
Are Campuses Echo Chambers Exploring the Information Networks of Contemporary Students
A Note on This Executive Summary
In the interest of readability, this executive summary was written to provide a brief overview of the project, the methodology that was used, and the key findings. A more detailed description of the undergirding literature, theory, and methods is available upon request to the author - nfh@g.ucla.edu.
Introduction and Problem Statement
The current political fragmentation of the United States has important consequences for civic engagement and the future of democracy. Both ends of the political spectrum engage in ideological homophily (Bright, 2018; Colleoni, Rozza, & Arvidsson, 2014; Stepanyan, Borau, & Ullrich, 2010) and the customizable nature of media consumption offered by social media sites like Twitter and Facebook contributes directly to this. By facilitating users’ selective exposure to consonant news, platforms like Twitter reinforce users’ existing beliefs, allow them to evade cognitive dissonance, facilitate media illiteracy, and enable hostile and uninformed discourse that only exacerbates fragmentation (Garrett, 2009; Kahne & Bowyer, 2017; Knobloch-Westerwick et al., 2017). The lapse in attention to facts and accuracy that results from the creation of online, ideologically driven “ad hoc publics” (Bright, 2018, p. 1) is well-documented and evident in growing perceptions of the media as hostile and biased (Barberá, et al., 2015; Barberá, 2015; Gil de Zúñiga & Chen, 2019; Price & Kaufhold, 2019; Weeks, et al., 2019). On college campuses, political fragmentation is similarly evident, particularly in qualitative studies of politically-engaged students (Binder & Wood, 2014; Havey, 2020a), which document increasing partisan splits between students along the political spectrum.
Within this contemporary online media ecosystem, the burden of evaluating the quality of information, formerly the purview and responsibility of news outlets and publishers, has shifted to the user (Flanagin & Metzger, 2007). This shift is concerning given that information consumers consistently seek out news consistent with their beliefs and rely on heuristics, such as the assent of other users in their social media feed, as proxies for credibility and relevance (Metzger et al., 2010; Metzger et al., 2020; Pearson & Knobloch-Westerwick, 2018). It is even more concerning because, under experimental conditions, most information consumers were unsuccessful when evaluating the credibility of the information they had found (Wineburg & McGrew, 2019). There is thus a two-pronged problem: 1) people are already bad at evaluating the information they consume and distribute and 2) they have become increasingly reliant on their social networks to drive their information exposure and consumption, relying on collective assent as a proxy for reliability and informed choice. This increasing lack of effort to evaluate information may be contributing to more partisan media exposure and a potential information gap (Licari, 2020) and may result in a less civically-engaged and informed public (Pearson & Knobloch-Westerwick, 2018).
This progressive increase in selective media exposure and subsequent degradation of information quality may also be disparately occurring along partisan lines. Though diverse news exposure has been consistently shown to strengthen democratic citizenship (Yang et al., 2020) and improve sociopolitical knowledge (Garrett, 2009; Licari, 2020), increasing partisanship has led to a population more susceptible to misinformation (Licari, 2020; Yang et al., 2020). This propensity for misinformation is exacerbated by the overall structure of the internet and social media platforms like Twitter. In digital spaces like Twitter, users’ connections drive their networks and the subsequent content they are exposed to and consume (Kwak et al., 2010; Steinert-Threlkeld, 2018). While social media spaces generally offer users increased access to broader dialectical spheres, theoretically contributing to the heterogeneity of social networks (Brundidge, 2010; Bakshy et al., 2015), this effect is reduced the more partisan the users are. Put plainly, highly polarized users are not going to be exposed to as much cross-cutting and ideologically-opposed content as more moderate users (Stroud, 2010).
With respect to Twitter, research indicates that political conservatives are far more likely to engage in homophily, clustering more tightly along ideological lines, than their more liberal peers (Colleoni et al., 2014). Further, Twitter users are also likely to follow political elites (such as politicians, pundits, and journalists) that align with their ideological positions (Weeks et al., 2019). Online, “birds of a feather tweet together” (Barberá, 2015; Himelboim et al., 2013, p. 154). Recent work also indicates that conservatives are worse at evaluating the credibility of sources and instead choose to trust their peer recommendations (Jost, 2017; Pennycook & Rand, 2019). Similarly, conservative outlets have been rated less credible than liberal ones even when controlling for the political ideology of readers and the outlets (Havey, 2021). Informational asymmetry in both exposure and consumption is thus possible, and perhaps even likely, along partisan lines. Taken together, the dual realities of partisan selective exposure and a general lack of effort to evaluate the credibility of information prompts clear concerns about the future of digital literacy and its subsequent impact on democratic engagement.
While people cannot be forced to consume information they are already resisting, attempting to remedy potential informational asymmetry on both sides of the political spectrum is crucial to mitigate the threats of digital illiteracy and further political polarization. While adults may be too separated from digital literacy initiatives and efforts to maximize their literacy, students are one possible population that may still be susceptible to interventions like lateral reading (Wineburg & McGrew, 2019). Evaluating selective exposure and identifying informational asymmetry among students is particularly important in the college context for two reasons. First, students have become increasingly polarized (Binder & Wood, 2014; Eagan et al., 2017; Havey, 2020) and are likely engaging in the same homophily, selective exposure, and partisan information seeking that is evident in studies of the general population (Barberá, 2015; Colleoni et al, 2014; Weeks et al., 2019). Second, traditionally-aged college students are regularly considered digital natives, though their inherent access to technology has not been proven to reflect any mastery when it comes to source evaluation and credibility assessment (Flanagin & Metzger, 2007; McGrew et al., 2019; Wineburg & McGrew, 2019).
This lack of mastery, coupled with campus homophily and selective exposure, has fueled tensions between students and student organizations with diametrically opposed viewpoints. Conservative students in particular have deemed student organizations, such as student newspapers and student governments, to be overtly liberal and thus less trustworthy (Binder & Wood, 2014; Havey, 2020a). This characterization of institutions of higher education as hostile to a diversity of viewpoints, particularly conservative viewpoints, has been similarly driven by external organizations such as the American Enterprise Institute, Turning Point USA, and Professor WatchList (Kissel, 2020). These characterizations, however, do not interrogate the informational quality presented when considering a diversity of viewpoints, nor do they question whether selective exposure persists across the political spectrum, which are key foci of this study. While topics of free speech, viewpoint diversity, and campus censorship are not the focus of this study, they provide useful context for exploring selective exposure and informational asymmetry along partisan lines, particularly as much of this discourse occurs online and involves students.
We know college students are using social media to get their news (Shearer, 2018; Wineburg & McGrew, 2019) and increasingly consuming information exclusively through digital mediums, but efforts to assess the political heterogeneity (selective exposure) and information quality students are exposed to and consume outside of experimental conditions have been marginal. A more thorough understanding of the average quality of information students are exposed to, as well as the relative political heterogeneity or diversity of that information is thus needed. Students can also be targeted for digital literacy efforts designed to improve their critical thinking skills and ability to adequately assess and consume information (Kahne & Bowyer, 2017; McGrew et al., 2019; Sinatra & Lombardi, 2020). While some of these efforts have been effective as interventions (lateral reading, for instance; Breakstone et al., 2018; Wineburg & McGrew, 2019) contemporary approaches to teaching digital literacy may not be enough to adequately prepare students for the current media ecosystem.
Research Questions
A heterogeneous, and credible news diet is good for empathy, cross-ideological exposure, and, thus, democracy (Price & Kaufhold, 2019). This study seeks to assess how ideologically diverse student information networks are, how quality differs across these networks, and whether there is clearly identifiable informational asymmetry within these networks. For the purposes of this study, I am operationalizing the quality of information students receive by identifying the outlets and information sources they select and curate into their networks and are thus exposed to, assessing their credibility, and calculating an average score for each student. As students increasingly rely on social media and their social networks for information, the choices they make with respect to curating those networks can be viewed as proxies for credibility assessments. Following the creation of student-level information network data, I will compare these scores to assess the overall networks for informational asymmetry.
Specifically, this study intends to document the information networks, the information providers and media outlets users are connected to online, of students at a variety of campuses and a range of institutional types. By collecting and analyzing these networks, I will present a snapshot of contemporary students’ exposure to news across the political spectrum, identifying the homogeneity and heterogeneity of their networks, the average size (number of outlets and information sources) of their networks, and the average network credibility, and how this differs by the ideological orientation of the user. This snapshot will also contain analysis of the overall quality of the information networks of the students in my sample.
I operationalize information quality as an average of the credibility ratings of outlets and information content providers within students’ information networks using secondary data from Ad Fontes Media. Ad Fontes Media is a nonpartisan nonprofit whose team of fact-checkers, journalists, and highly-trained evaluators assesses the overall reliability and bias of media outlets through a rigorous and replicable methodological approach. Though credibility is an inherently subjective metric based on perception, the static nature of these ratings will allow me to concretely evaluate just how students are at parsing where their information is from, how good it is, and whether the quality of information differs along partisan lines (informational asymmetry) which is a crucial and necessary precursor to informed civic engagement. To this end, this study is guided by the following research questions:
- What do the information networks of students on Twitterlook like?
- How similar are these networks?
- How ideologically diverse are the information networksof students on Twitter?
- Are the information networks of students active onTwitter asymmetric with respect to the quality and reliability of the sources that comprise them?
Methods
In order to answer the research questions and test the above hypotheses, this study’s multistage quantitative design utilizes a multisite social network analysis approach, basic descriptive statistics, and t-tests. Passy and Monsch (2014), Thomas (2000), and other scholars have recognized the importance of social networks for examining complex behaviors and relationships. This study’s focus on individual (user) and aggregate data warrants a closer look at the networks that comprise both data strata. The first stage entails identifying students across a variety of institutional types who maintain active Twitter accounts and extracting their information networks and estimated political ideologies. In the second stage, students’ data is collected and additional variables are calculated based on latent attribute inference and social network features. The final stage includes social network analyses and descriptive statistics at an aggregate level. This multistage design is ideal for a study on student social and information networks because it offers data that can make relational behaviors more plain (Thomas, 2000) and can describe the networked decision making strategies students engage in when it comes to information and media exposure (Shearer, 2018; Wineburg & McGrew, 2019) on a social and information platform like Twitter (Kwak et al., 2010; Steinert-Threlkeld, 2018).
In the sections that follow, I describe how I selected sites (institutions) to identify and include students from and how I both accessed the sites included in my analyses and did not access particular sites that were subsequently excluded. Next, I describe how I approached data collection, including identification and collection of primary (student-level) data, as well as the secondary data I integrated into my analyses from Ad Fontes Media. Finally, I describe my approach to data analysis. Following the presentation of my analytical approach, I describe relevant limitations and considerations for the research and close the chapter with a positionality statement that includes my own information network.
Site selection for this multisite, multistage quantitative research study was informed by Binder and Wood’s (2014) work detailing student political activity on a handful of campuses and my own work regarding student political organizing on three separate campuses (Havey, 2020a). Both Binder and Wood’s (2014) multisite ethnography and my own multisite case study (Havey, 2020a) reveal stark differences in the strategies, behavior, and interests of politically-active students. Following these findings, I chose to include students from a variety of campuses representing a range of institutional types, student body compositions, and institutional missions. The intentional inclusion of a wide variety of institutional types responds to Binder and Wood’s (2014) call to explore student political activity at a broader diversity of campuses and my recommendations to investigate student political activity using quantitative methods (Havey, 2020a).
Data Sources
There are two data sources for this study. The first data source is primary and is drawn from identified students’ Twitter accounts. The second data source is secondary and comes from Ad Fontes Media, a nonprofit media credibility organization whose name literally means “From the Source.” Ad Fontes Media rates media outlets and podcasts for both bias and credibility; this study only incorporates their credibility ratings. Bias values for both student users and media outlets will be calculated using Barberá’s (2015) R package tweetscores.
Student Data
The first data source used in this study is primary and drawn from students’ Twitter accounts. Students’ Twitter accounts were identified through manual review of institutional and institution-affiliated Twitter accounts’ followers and friends. My general workflow for student identification proceeded as follows and was designed to identify as many students per campus as possible and to maximize variance in political orientation and student experience (student journalists versus fraternity and sorority members, for instance) where possible1. First, I identified the institution I was identifying students from (for instance, the University of California, Los Angeles). I began my search by identifying institutional and institutionally-affiliated accounts for that school, such as the school’s main account (ex: @UCLA), the school’s student newspaper (ex: @dailybruin), and the school’s main student political groups (ex: @BruinGOP, @BruinDemocrats). After identifying an initial sample of institutionally-affiliated accounts, I review the Twitter users that these accounts were following and followed by. The large accounts, such as the main UCLA institutional account @UCLA, which has over 200,000 followers, provided a broad field to extract users from so I started by reviewing who the account followed (200 users) and extracting accounts of interest, which included a variety of institutional centers and departments. These institutionally-affiliated Twitter accounts served as sampling centers from which I was able to identify individual students. Once I identified a sufficient quantity of institutionally-affiliated accounts / sampling centers, I reviewed those accounts’ followers and friends (who they follow) for snowball sampling (Goodman, 1961) of additional accounts to review. I also simultaneously extracted individual student accounts who were followed by or following these accounts alongside my identification of additional sampling centers. I continued this process until I identified an adequate sample of students across a variety of experiences and political orientations. I aimed for a minimum of 100 students per campus, though some campuses in the sample have fewer students based on their overall enrollment. Similarly, some campuses were easier to identify students for and thus boast a larger proportion of the overall sample.
After identifying a sufficient number of students for the campus, I calculated each student’s Twitter User ID (an alphanumeric code unique to their account that does not change even if they alter their username) and subsequently calculated their estimated political ideologies using Barberá’s (2015) tweetscores R package.
Barberá’s tweetscores package utilizes a Bayesian ideal point estimation approach to categorize users in comparison to a training set of politically elite users (Barack Obama, Hillary Clinton, Bernie Sanders, Glenn Beck, etc.) and assigns them a political ideology score based on their association with Twitter elites. The tweetscores package was validated on a dataset comprised of millions of tweets and millions of unique users discussing a variety of extremely political and polarizing topics (such as elections) and more apolitical (sports) topics and has been validated by other researchers, including myself (Havey, 2020b).
As the tweetscores tool has already been well validated in the literature, I did not engage in successive validation within this study, though I did manually review estimated political ideologies for users identified from select political student organizations (i.e. the Bruin Republicans) to verify the package was working as intended. I found no discrepancies. Where association with elite users was unidentifiable for a particular student [i.e. a user failed to follow any of the politically elite users in Barberá’s training set (senators, politicians, partisan news personalities, etc.)], secondary estimation of their political ideology was achieved through correspondence analysis, or analysis of a user’s discursive and relational habits (this analytical pathway leverages a user’s interactions with other users, here, students, who follow political elites for ideological estimation). The estimated political ideologies for student users fell on an existing scale (which includes Barberá’s sample of political elites) ranging between -2.5 (extremely liberal) and 2.5 (extremely conservative) with moderates occurring roughly between -0.4 and 0.4, liberals occurring between -0.4 and -2.5, and conservatives between 0.4 and 2.5 (Barberá, 2015). Where students’ political ideologies could not be estimated using either method, I assigned them a value of zero and removed them from the dataset prior to further analyses. This resulted in a sample reduction of between 8-15% per campus.
Following user identification, I extracted the user’s information network (the news outlets and information sources they follow) using the Twitter API and Kearney’s (2019) rtweet R package and calculated the size of each students’ network (how many outlets or information sources they follow), the average estimated political ideology of the network (also calculated using Barberá’s (2015) tweetscores R package), the mean and standard deviation of the estimated political ideologies of the outlets in the network, the difference between that mean and the student’s estimated political ideology, and the average credibility rating of the network (an average of the outlets’ and information sources’ credibility ratings, integrated from Ad Fontes Media’s data).
Data from Ad Fontes Media
Some of the secondary data used in my analyses comes from Ad Fontes Media, a nonprofit organization focused on assessing information credibility and bias. Ad Fontes Media takes a comprehensive approach to evaluating information sources for credibility and bias. As part of my preparation for this study, I participated in a six-week webinar series put on by Ad Fontes Media designed to help educators further literacy curriculums and approaches to evaluating content. Ad Fontes Media’s approach is driven by a team of analysts from across the political spectrum who review and assess multiple articles per source (anywhere from 100 to several thousand) to get an idea of where the outlet lands in comparison to other outlets in terms of both political bias and credibility. Ad Fontes Media’s analysis is driven by content and centers on expression, veracity, and headlines. Each overall outlet credibility score is calculated as a weighted average of all of the articles reviewed for the source and are updated regularly. For the purposes of this study, I have incorporated credibility scores for 300 news outlets and sources from Ad Fontes Media and assigned them estimated political ideologies based on the tweetscores R package. A list of the sources I include in this study is included in Appendix 1.
Data Analysis
Data analysis proceeded associated with the research questions. First, I created and organized multiple parallel central data repositories that include all information collected for outlets and information sources (including their Twitter usernames, alphanumeric Twitter user IDs, estimated political ideologies, and credibility ratings) and information collected for students (their Twitter usernames, alphanumeric Twitter IDs, estimated political ideologies, network size, average network political ideology, standard deviation of outlet political ideology, difference between the average network political ideology and the user’s estimated political ideology, and average network credibility scores). Following the creation of these central data sets, I conducted aggregate network analyses to identify the overall average network political ideology, the overall average network credibility score, and the most-followed outlets and information sources within the entire dataset. I also conducted aggregate-level descriptive statistics on the dataset to answer the research questions (detailed below) and ran a simple linear regression to see if any of the student-level variables predicted overall network quality. The two data sources are described below, the data analysis is presented in the results section.
Outlets
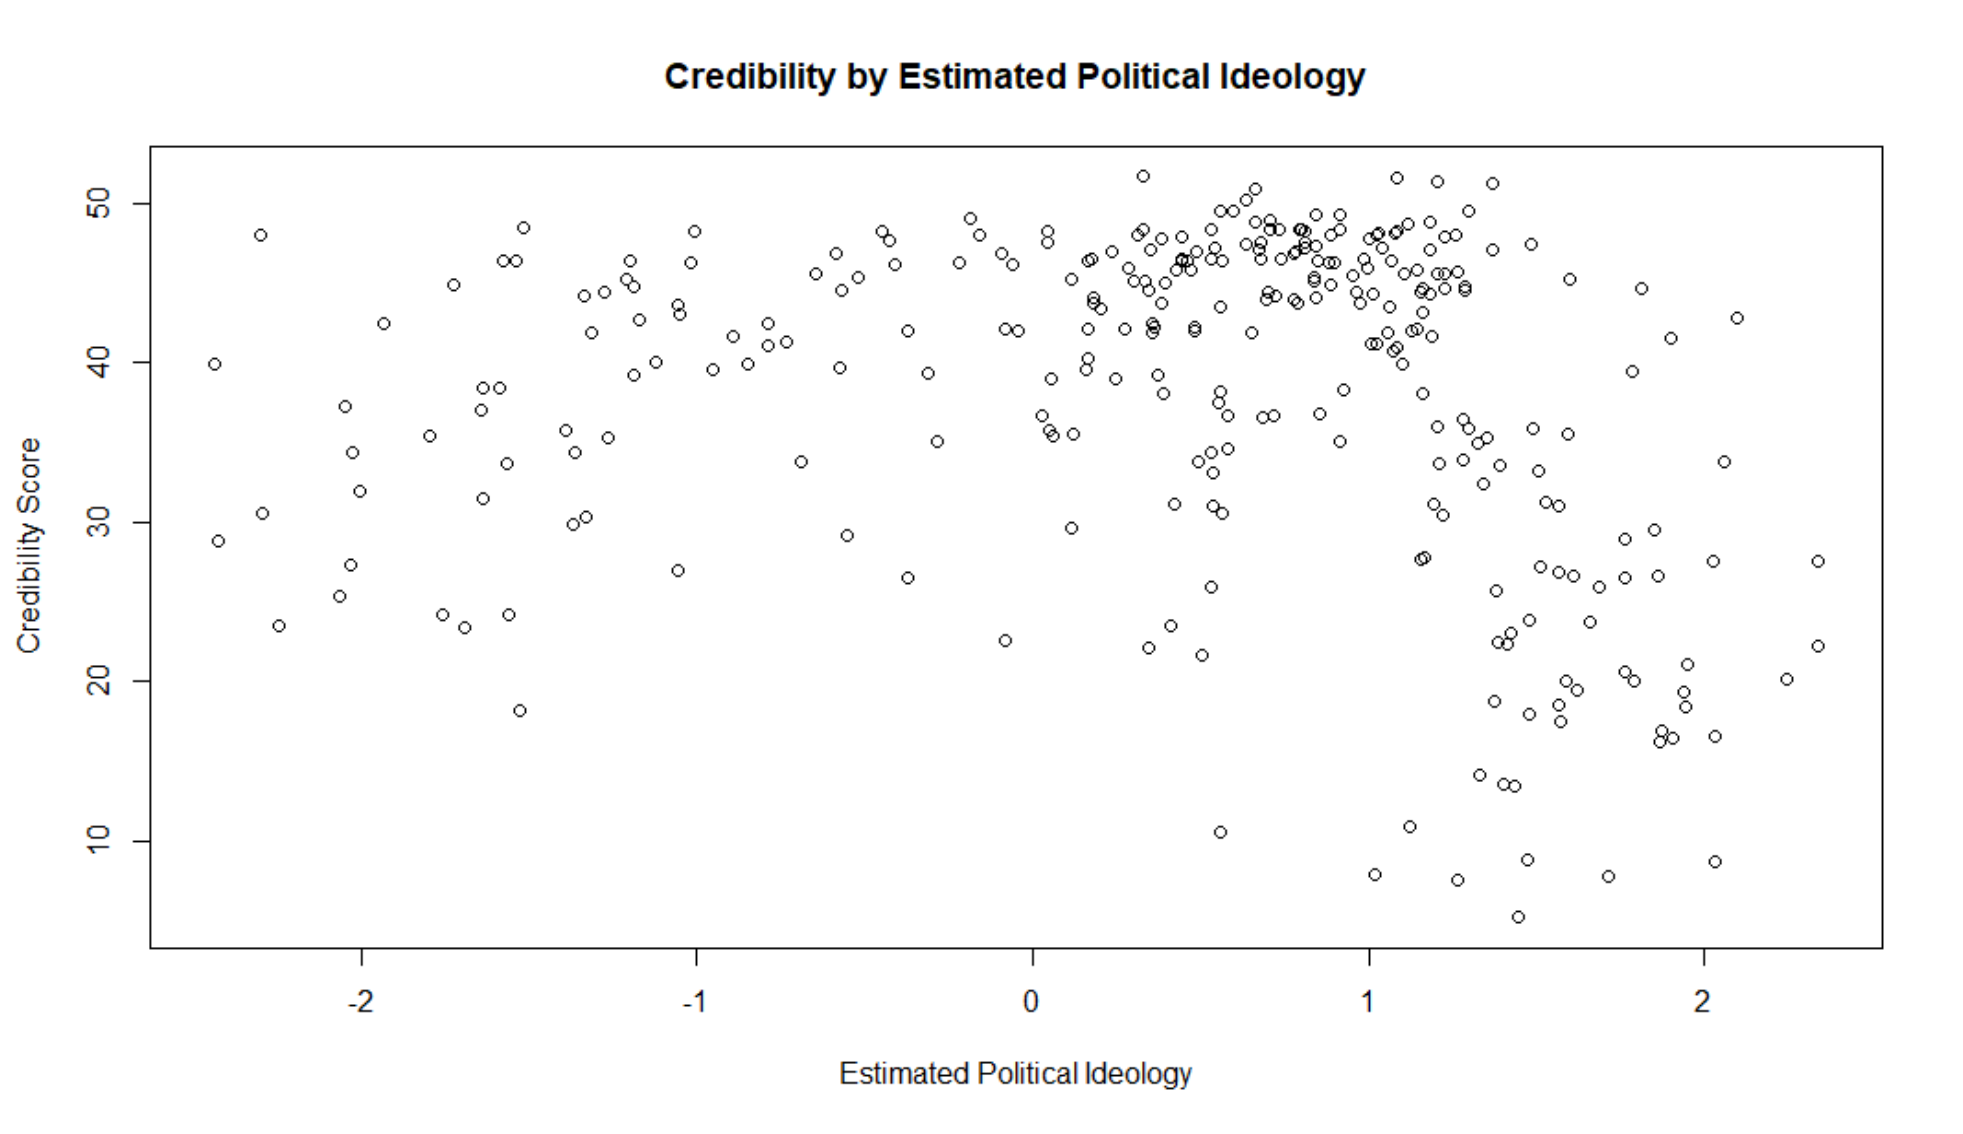
The first step for this study was to create a repository of outlet-level variables for use in subsequent analyses. In my pilot analyses, I manually reviewed students’ Twitter friends (who they follow) for information sources and news outlets to identify and include in my analyses. After reviewing 100 unique students, I began to stop identifying new outlets and decided to create an extraction file to compare students’ friends to. Due to the limited nature of the secondary data available (i.e. the number of outlets, podcasts, and information sources that Ad Fontes Media has rated), I created this extraction file by including all information sources Ad Fontes Media had rated and including additional sources whose credibility ratings could be tied to an existing Ad Fontes score (i.e. considering CNN and CNN Breaking News as comparable sources with respect to credibility but separate sources with respect to students’ networks). Though Ad Fontes Media also rates outlets on political bias, their ratings are on a separate scale than the student estimations calculated using Barberá’s (2015) tweetscores R package, so I similarly calculated outlets’ and information sources’ estimated political ideologies using the Bayesian point estimation approach within tweetscores and correspondence analysis where necessary. After identifying all of the available sources I could link secondary Ad Fontes Media data to, I finalized the outlets data set and utilized it when extracting students’ networks. These outlets are listed in Appendix 1. The distribution of these outlets along the political spectrum and their credibility ratings is available in Figure 1. The average estimated political ideology of these outlets is 0.4619, or just right of center, and the average credibility score is 38.15 out of a possible 64.
Students
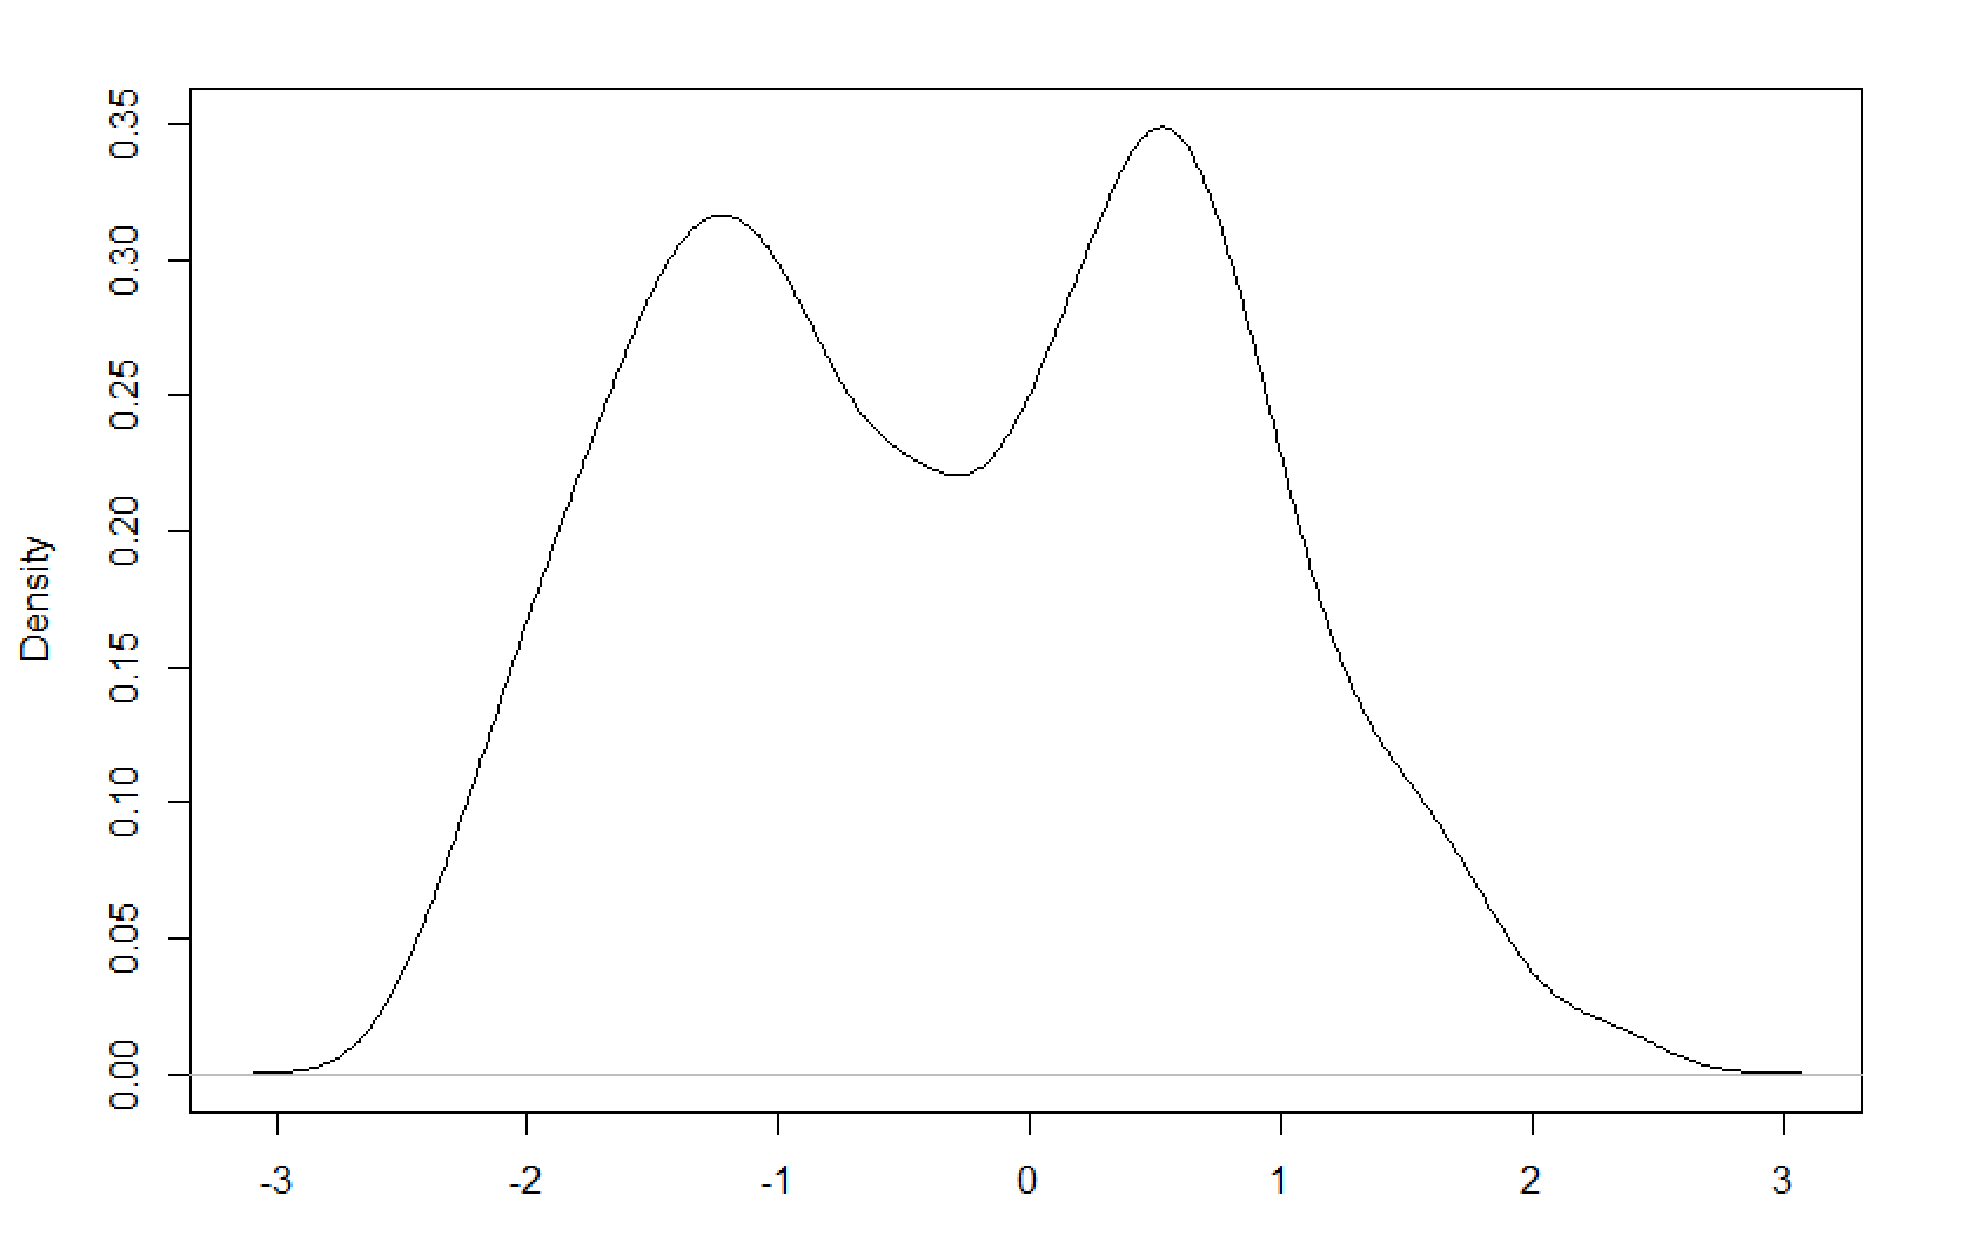
Following the creation of the central data set for outlets and information sources, I created a central data repository for the identified student Twitter user profiles within the study. As described above in the data collection portion of this chapter, I identified students at a variety of institutional types through manual review of Twitter profiles. After I identified the students in my overall sample, I utilized Kearney’s (2019) rtweet package to extract both their Twitter user IDs and who they follow on Twitter (their networks). After extracting their overall Twitter networks, I used the outlets and information sources extraction file described above (see Table 1) to pare down these networks to only reflect the Twitter accounts unique to their information networks (i.e. I removed friends and other accounts that were not identified within the extraction file). After reducing their networks to stable information networks, I merged the outlet and information source data (estimated political ideology and credibility scores) to each source. After calculating these values, which incorporated data including multiple observations per student (who they followed), I reduced this data to reflect one observation per student and maintained the relational data for the network analyses, described below. The distribution of students’ political affiliations (narrowly defined along the traditional liberal to conservative spectrum in the United States of America) is available in Figure 2. The mean political affiliation for the sample (n = 2205)2was -0.01384, or fairly moderate, which is consistent with survey data regarding student political affiliation (Eagan et al., 2017), though the largest subgroup of students within the sample was slightly to the right of dead center politically.
Limitations
There are some key limitations to the data utilized in this study. First, not everyone is on Twitter. Twitter skews young, white, and educated (Kwak et al., 2010; Steinert-Threlkeld, 2018) which may have resulted in an overrepresentation of white, traditional students. Similarly, a decent portion of the students I identified as conservative had private accounts, which may result in the final sample presented in this study skewing more liberal; this may be exacerbated by the general population demographics of students in the United States of America, with conservative students representing the smallest overall subgroup and moderates reining as the majority (Eagan et al., 2017). The sample might also overrepresent students who are already more involved than their peers purely by virtue of being on Twitter -- many of the students sampled in this study belong to student organizations and have Twitter accounts to participate in ongoing discourse central to those organizations’ missions. For instance, student journalists may be overrepresented in the sample because they were the easiest to identify during manual review of student populations on Twitter. Another student-level limitation is that, though I strove to ensure that the students I included in my sample were active on Twitter (i.e. tweeted in the last two or three months), some students may maintain Twitter accounts that they do not use as their primary social media platform. This might result in information networks and subsequent aggregate-level data that leaves out some of the other information seeking behavior students may be engaging in.
At an outlet level, this study is limited by the availability of secondary data from Ad Fontes Media. While the 300 outlets and information sources presented in Table 1 offer a robust slice of the information landscape, they cannot be fully representative of how students are consuming information online. Similarly, several of the more conservative outlets included in Ad Fontes Media’s data had to be excluded from this study because they have been banned from Twitter for violating Twitter’s terms of service and cannot be readily identified as being part of students’ information networks.
Finally, this study exclusively looks at Twitter users, limiting its utility in describing contemporary student information seeking, as more and more students may be using other platforms such as Facebook, Instagram, and TikTok as part of their information consumption. While Twitter makes data far more accessible to academic researchers, future studies should consider qualitative approaches to investigating other platforms.
Positionality of the Researcher
I close this section with a positionality statement. While positionality statements are less common in quantitative work like this study, I believe acknowledging my own position to the students who comprise the data in this study and my position to the research is critical in understanding my approach, my biases, and my rationale for the work (Hope et al., 2019). In my effort to present a critical quantitative positionality statement, I have included my own information network. This network includes the 17 information sources and outlets I follow on Twitter that are included in the data for this study, including: NPR’s Consider This, The New Yorker, Teen Vogue, CNN Breaking News, CNN, The Associated Press, HuffPostEducation, HuffPost College, Unlocking Us with Brene Brown, FiveThirtyEight, NewsWeek, NPR, Vox, New York Times Opinion, Jezebel, The New York Times, and the Washington Post. The average estimated political ideology of my information network is -0.2354406471 and the average credibility of my information network is 42.33470588 out of 64. This is slightly worse than the average quality of the networks of the students in my sample. While my own estimated political ideology is -1.435039195 (solidly liberal), the average estimated political ideology of my information network is within the moderate range for the data, leaning slightly to the left, suggesting I consume a decently diverse news and information diet that is significantly more moderate than my own political identity. I do not, however, consume information from any outlets or sources that would skew my information towards the more conservative. With respect to this study, I endeavor to be cognizant of my positionality as a liberal Twitter user whose information network is markedly moderate and understand that I may encounter student information networks that are well-aligned with my own and also ones that are deeply dissonant. My goal is to honor the data I collect and analyze and present findings that reflect the reality of that data.
Results
Research Question 1: What Do the Information Networks of Students on Twitter Look Like?
I began my analyses by returning to the research questions. The first research question, what do the information networks of students on Twitter look like?, was answered through network analyses and visualizations of the student-outlet-level edge data.
To answer this question, I extracted the outlets and information sources each identified student followed on Twitter, assigned previously calculated estimated political ideologies to those outlets, and visualized each students’ network in concert with their peers. Below, I present three network graphs, the first of which contains all relationships between students and information sources for all students in the set, the second of which contains those relationships for students I calculated as conservative (0.5 and above, n = 625), and the third of which contains those relationships for students I calculated as liberal (-0.5 and below, n = 1001). The remainder of the students were between -0.5 and 0.5, and I classify them as moderates. For the purposes of this study, their relationships are not depicted as they are more closely aligned with the relationships depicted in the network for all users (n = 579). The visualizations represent each student or (a singular dot) recolored based on their political affiliation (from bright blue to bright red from negative to positive values for their estimated political ideology) and resized based on the number of followers within the set (students all have a follower count of 1, whereas some of the outlets have upwards of 1000 followers).
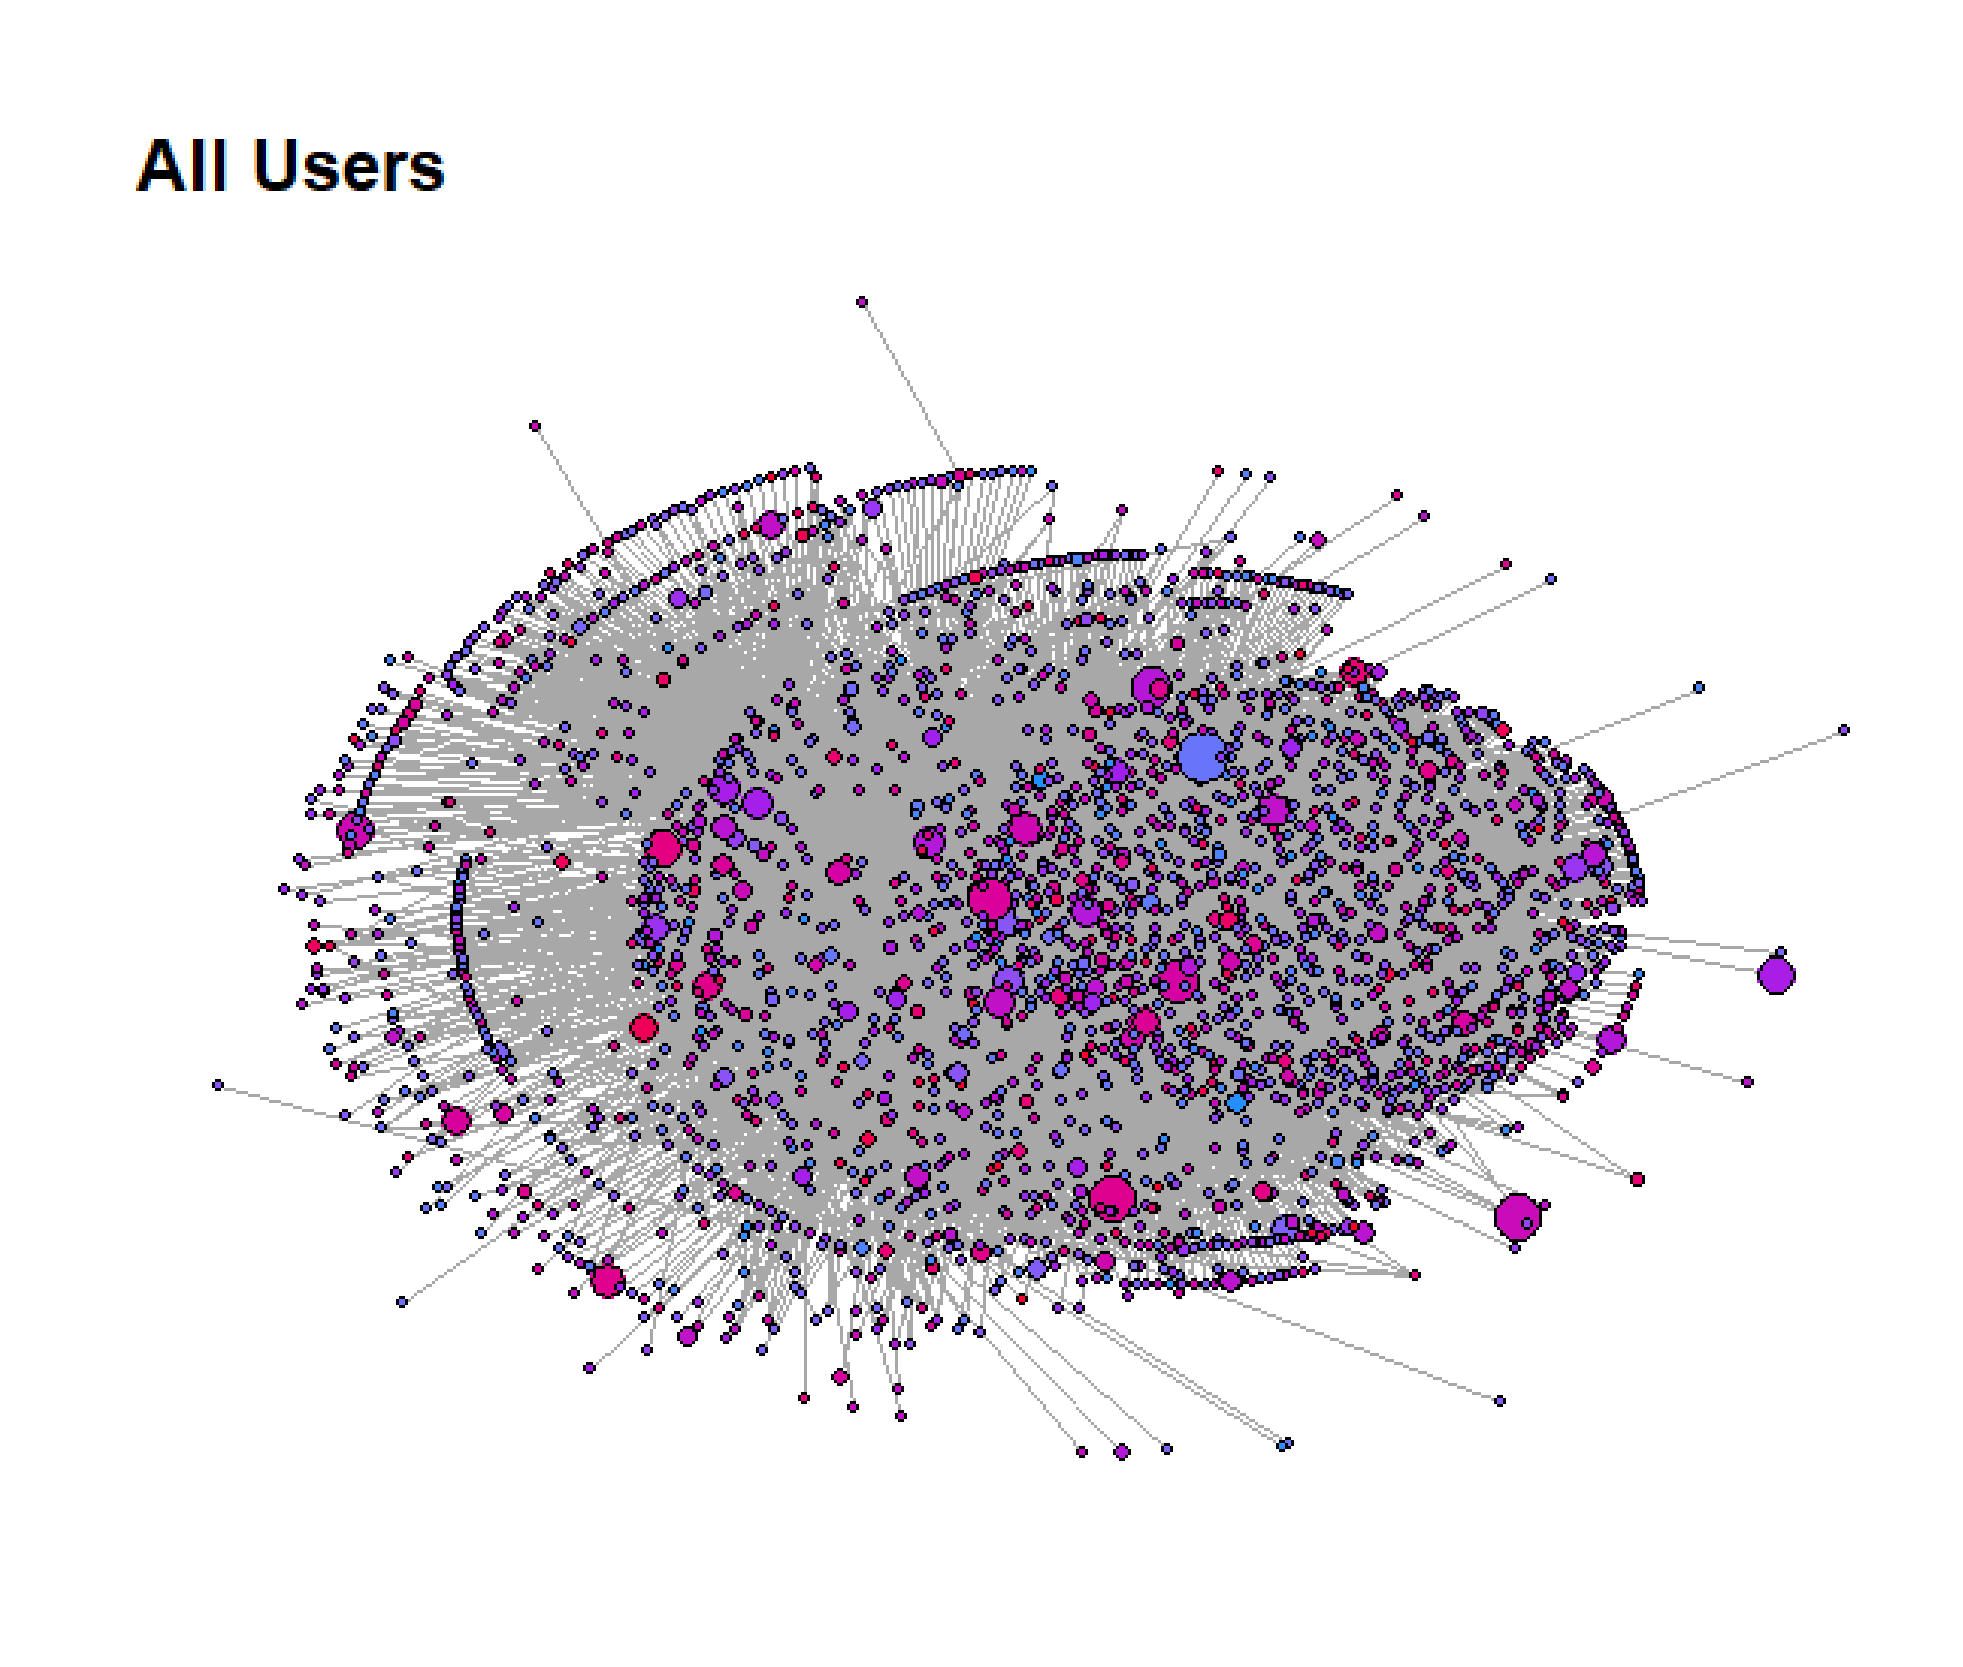
The first network graph depicted, Figure 3, shows the relationships between all students (n = 2205) and the outlets they follow for a total of 20394 relationships (edges). The average size of a student’s individual network is 8.25 outlets, the average credibility of a student’s network was 42.55, and the average estimated political ideology of a student’s network was 0.365 (slightly more conservative than the average estimated political ideology of the students in the sample). While the visual representation of these relationships is not immediately clear, there are a few key features of this network to note. First, the core of the network is predominantly people, reflecting the average estimated political ideology per network of 0.365. Second, there are some smaller, yet sizable, red nodes on the fringes of this network, representing more conservative networks that were not followed by the more moderate student core. There are no clearly identifiable medium to large blue nodes, suggesting that there are not fringe liberal outlets that are not followed by the core of this student sample.
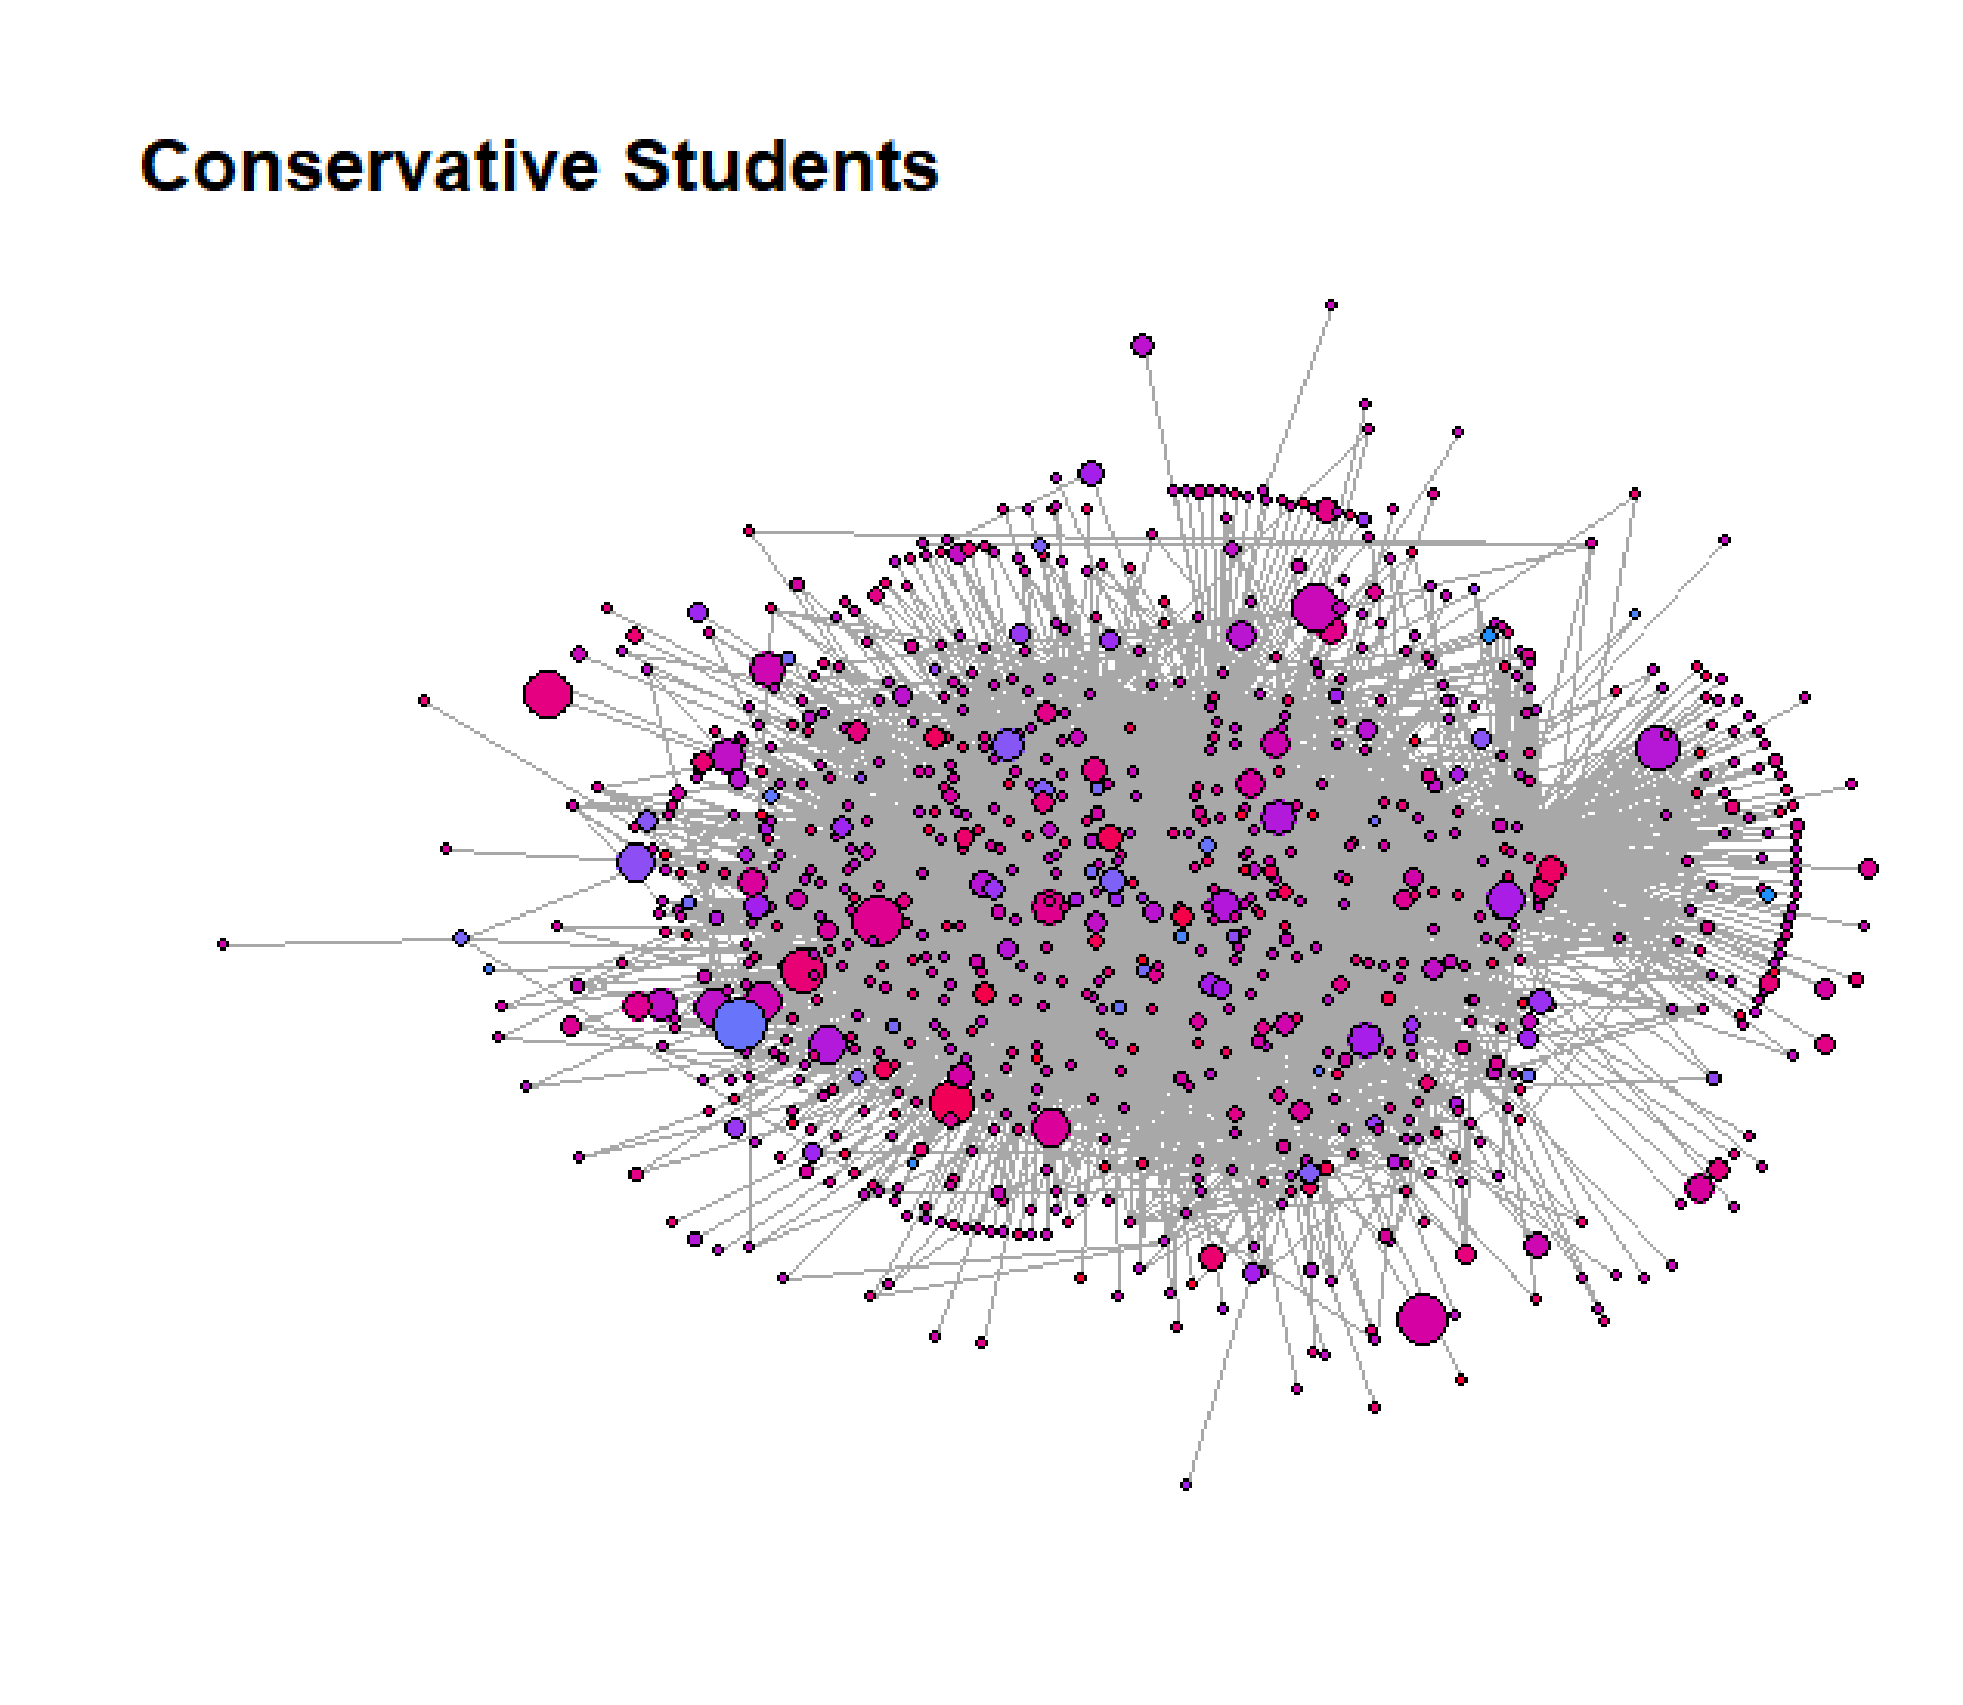
The second network graph depicted, Figure 4, shows the relationships between conservative students (n = 625) and the outlets they follow for a total of 6083 relationships (edges). The average size of a conservative student’s individual network is 8.74 outlets, the average credibility of a conservative student’s network was 40.517, and the average estimated political ideology of a student’s network was 0.749 (significantly more conservative than the average estimated political ideology of the students in the sample). There are a few key features to note in this network graph. First, the larger nodes are more red than in the previous network, indicating that conservative outlets were favored by conservative students. Second, one of the largest nodes is blue. This node, the New York Times, was the most followed outlet within the entire dataset. Finally, this network is less diffuse than the network for all users, indicating that conservative students in the sample made similar choices when it came to network curation.
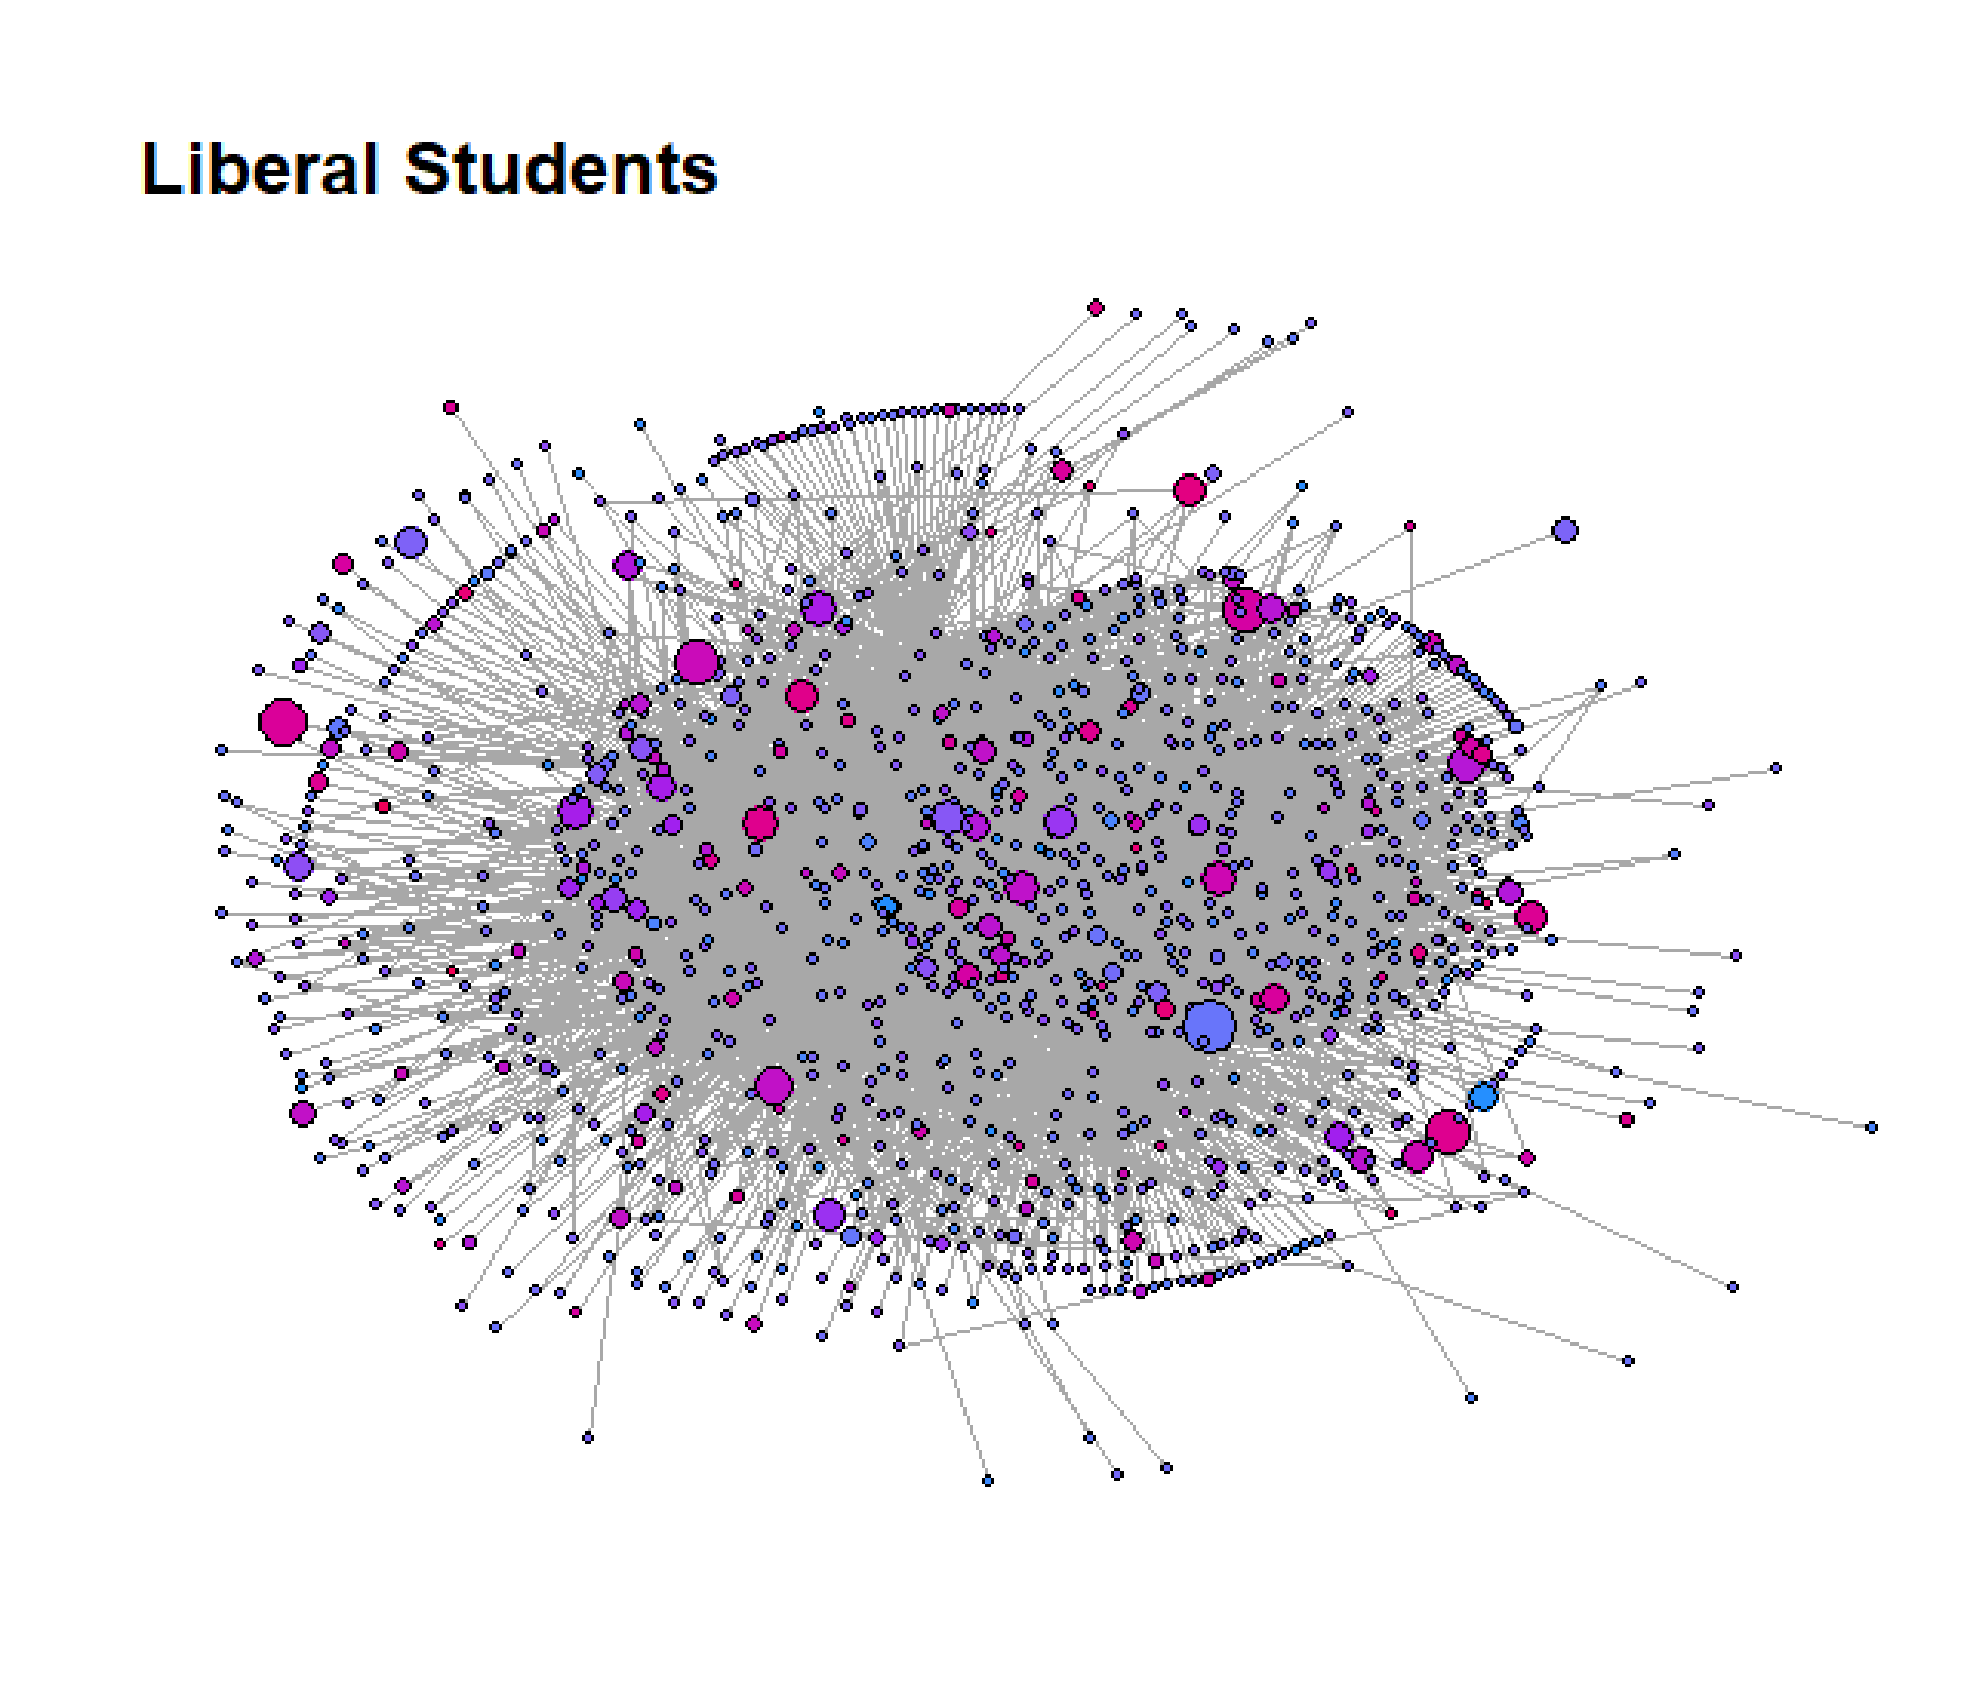
The final network graph depicted, Figure 5, shows the relationship between liberal students (n = 1001) and the outlets they follow for a total of 7823 relationships (edges). The average size of a liberal student’s individual network is 6.81, smaller than the average for the entire sample; the average credibility of their networks is 42.67, slightly higher than the entire sample; and the average estimated political ideology of their networks was 0.168, more liberal than the overall sample but still to the right of the average estimated political ideology for students in the sample. Like the other graphs, there are a few things to note here. The first is that there is greater variation in the estimated political ideology of the larger nodes, indicating that liberal students consume a more diverse news diet than their conservative peers. Similarly, there are not any fringe outlets that are distinctly outside of the core of the network. That being said, these visualized differences do not fully explain the differences in information networks across the political spectrum, nor do they indicate any form of informational asymmetry.
Research Questions 2 &3 : How similar are these networks? How Ideologically Diverse Are the Information Networks of Students on Twitter?
To gauge the similarity of student information networks across the political spectrum and assess how ideologically diverse these networks are, I ran simple descriptive statistics on a handful of network measures, specifically: network size, average network estimated political ideology, average network credibility, the average standard deviation of outlet political affiliation in each student network, and the difference between a student’s estimated political affiliation and their information network’s estimated political affiliation.
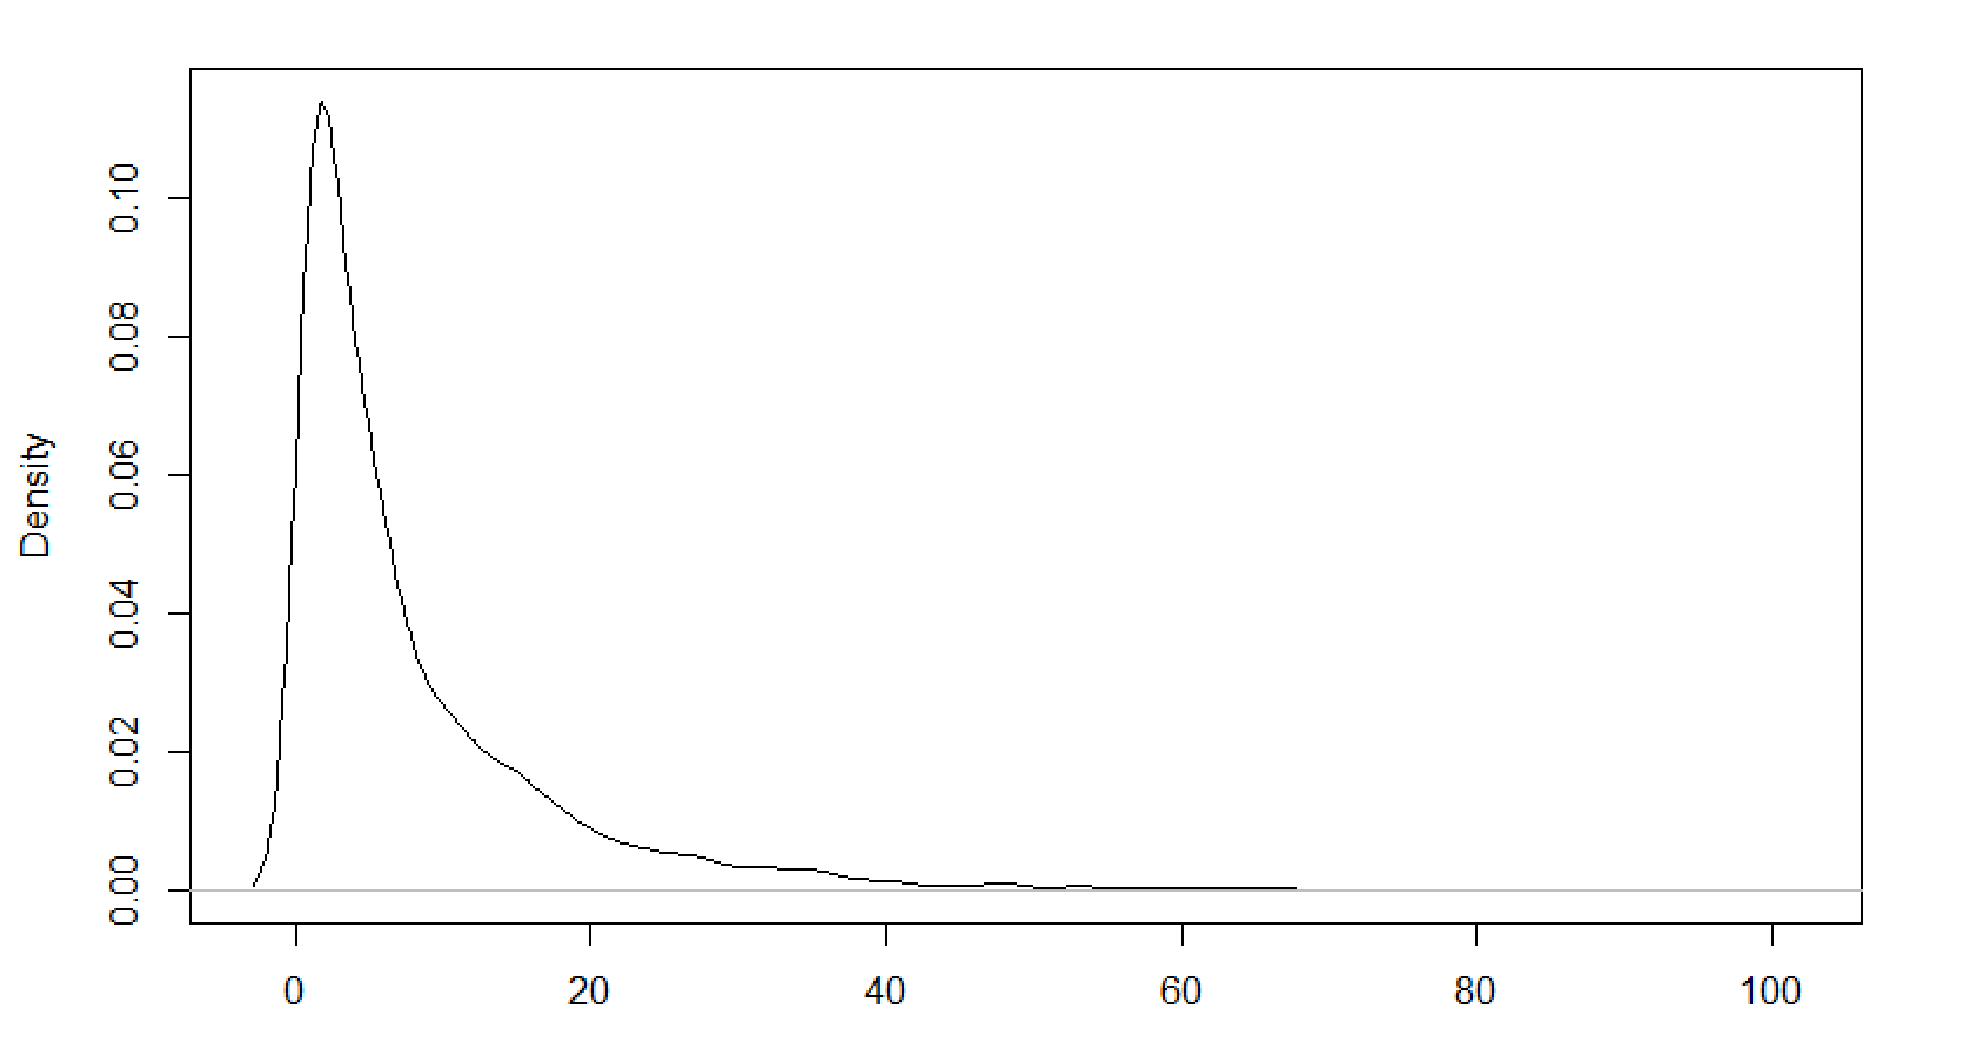
The average network size for all users in the sample was 8.24; the standard deviation for network size was 10 (there were many students who followed significantly fewer outlets and many who followed a large quantity. This distribution is available in Figure 6.
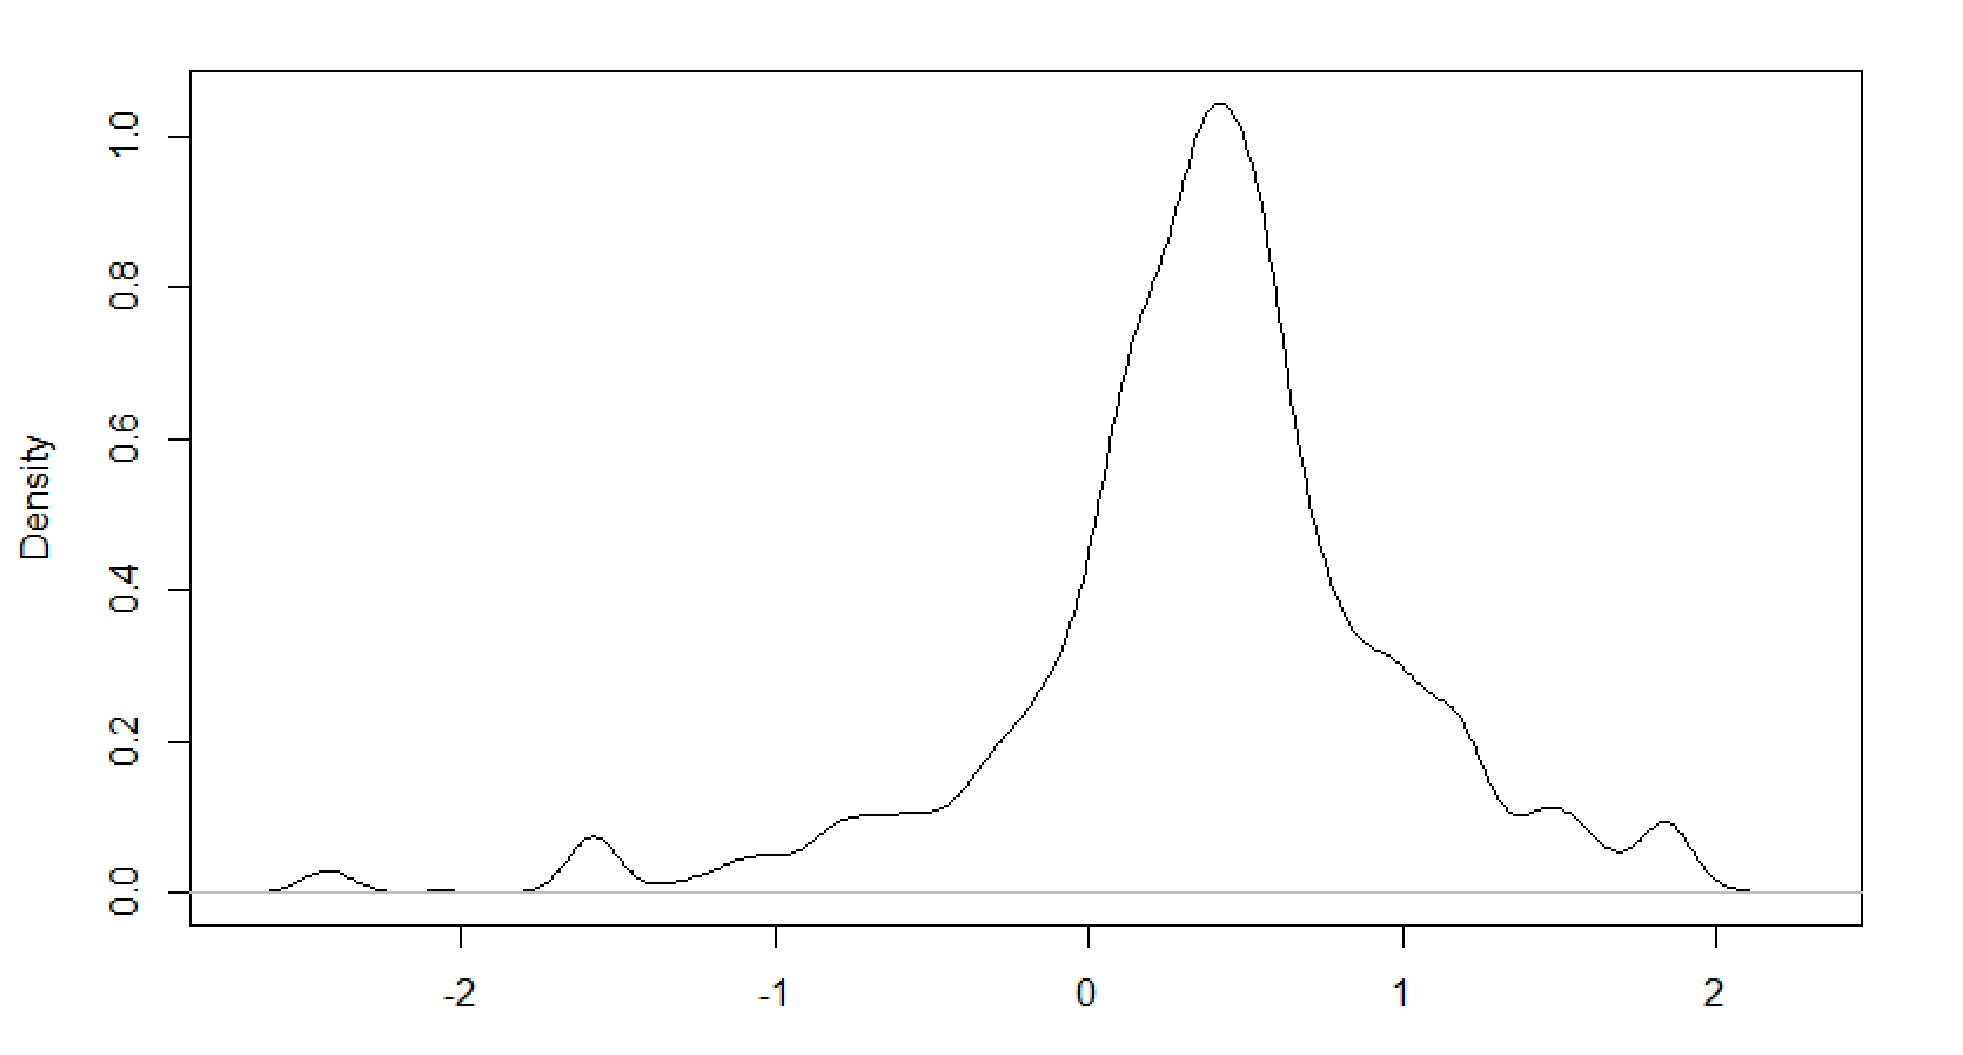
The average network estimated political ideology for all users in the sample was 0.365; the standard deviation was 0.62. This distribution is available in Figure 7. There were few users in the sample with extremely polarized networks, though there was a greater degree of polarization among conservative students. This is consistent with the network visualizations.
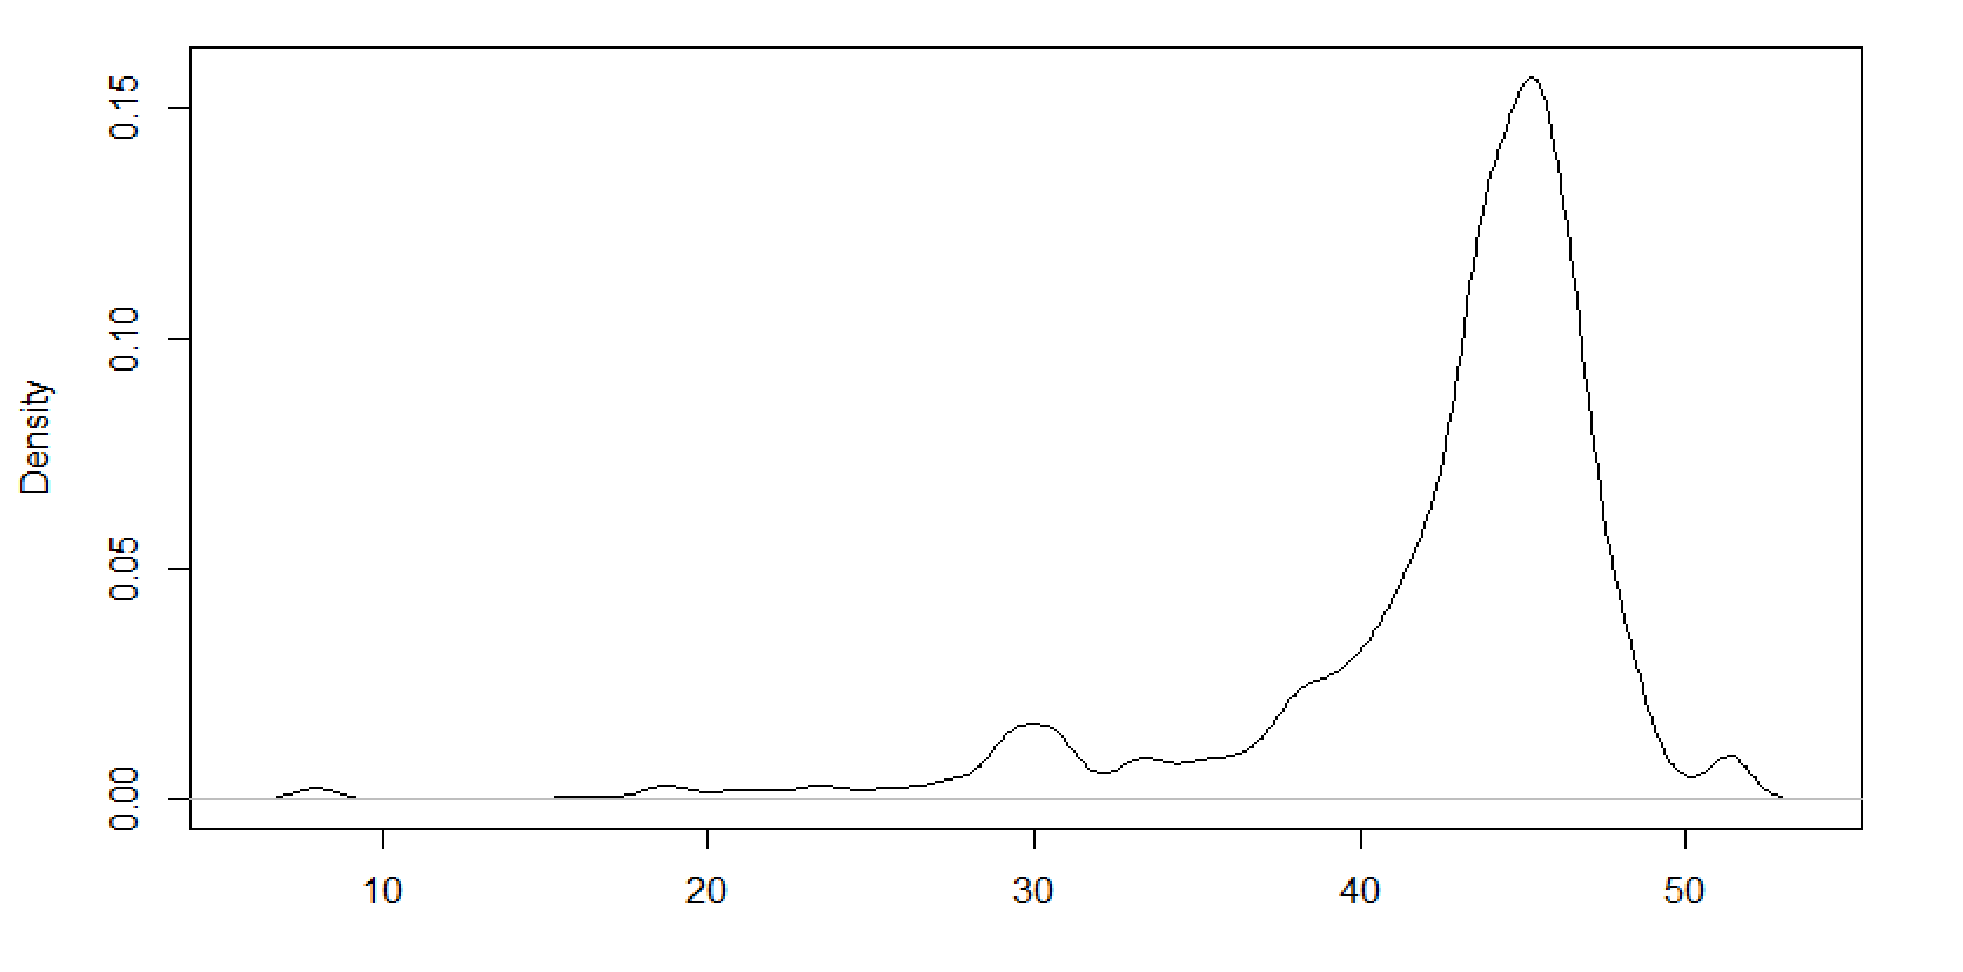
The average network credibility score was 42.55; the standard deviation was 5.81. This distribution is available in Figure 8. The general network credibility represented in the sample was fairly high (42.55 out of a maximum score of 64).
The average standard deviation of the estimated political ideologies for each outlet in a student’s information network was 0.69; the standard deviation of that deviation was 0.49. This distribution is available in Figure 9.
The density value for 0.0 represents students whose networks consisted of a single outlet. This distribution indicates that students’ networks were, for the most part, variable with respect to the ideology of the outlets that comprised them.
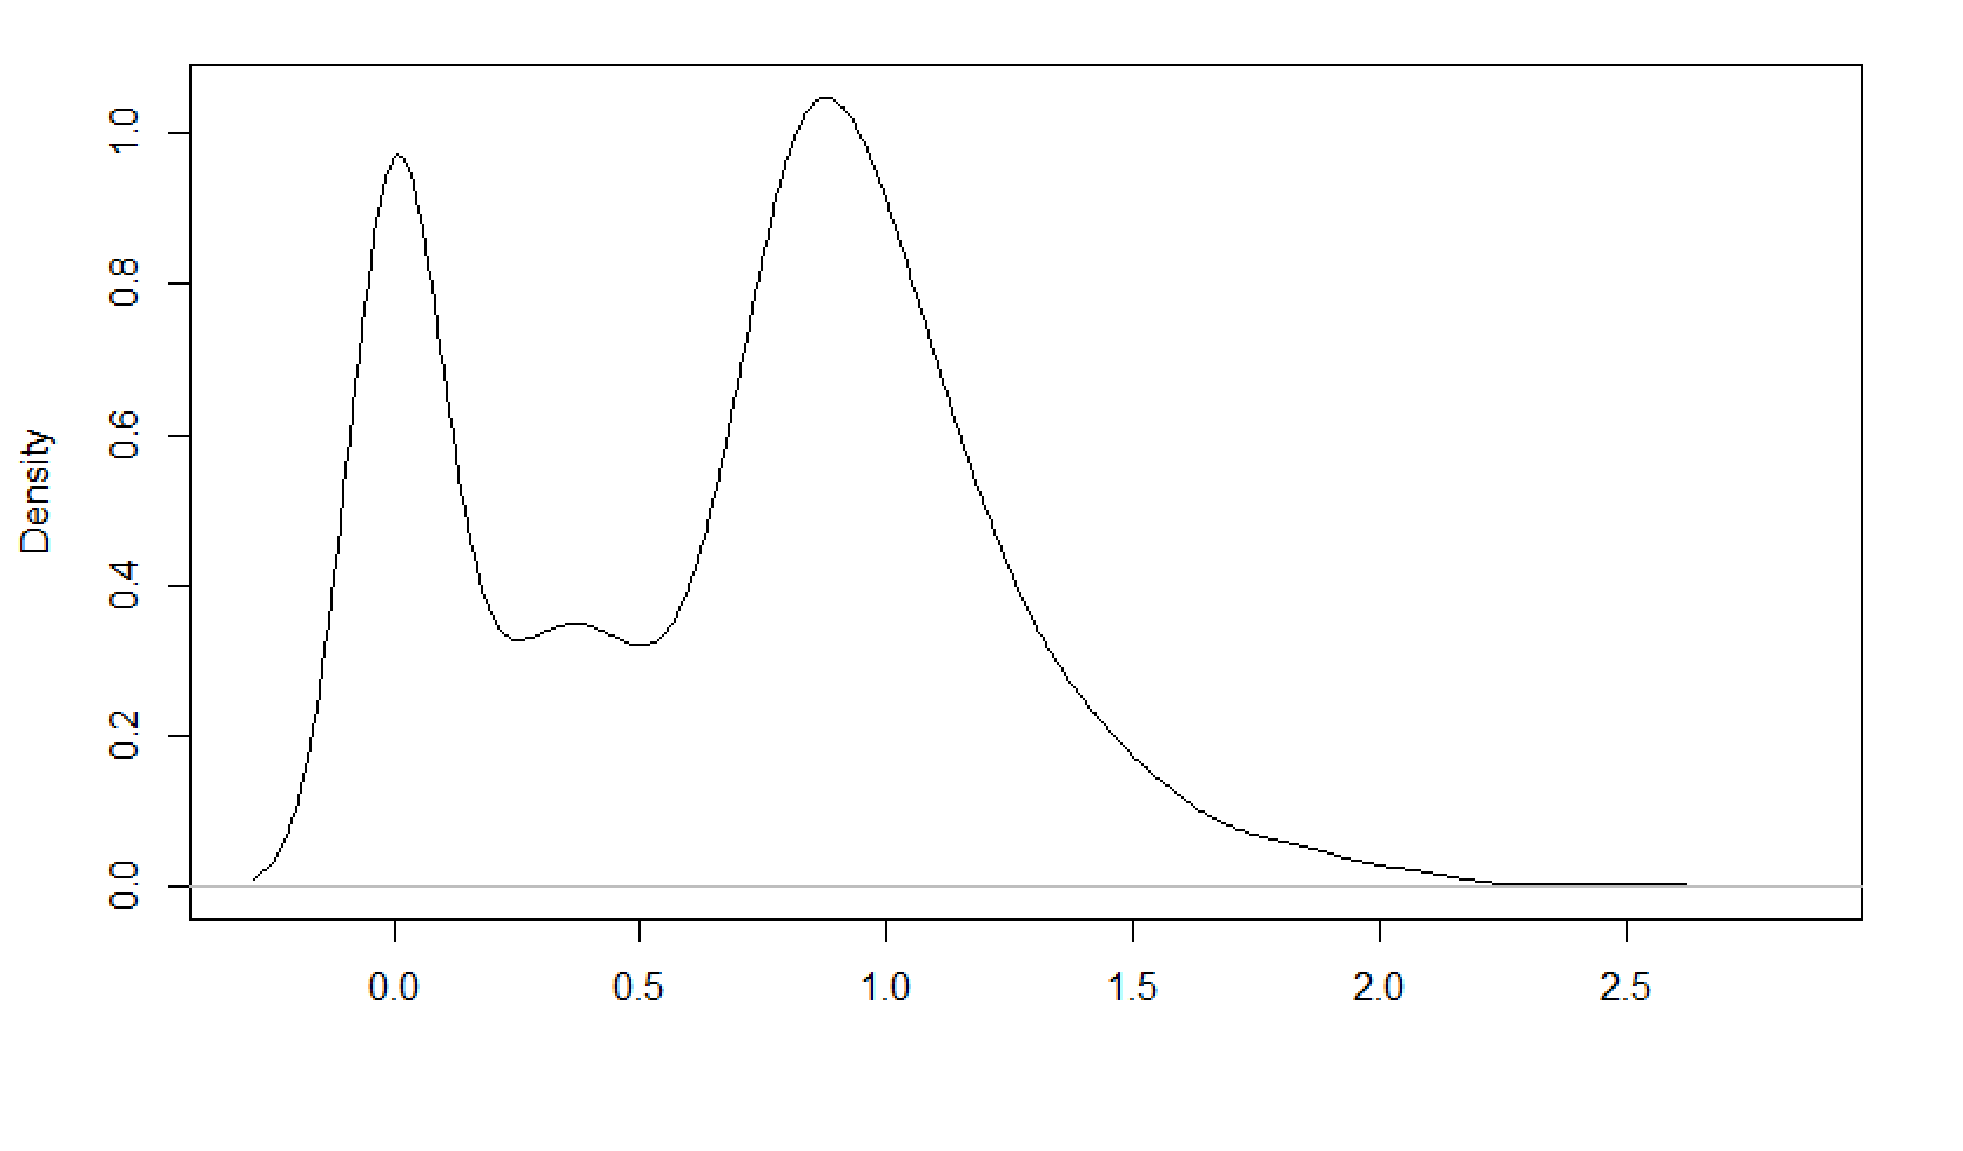
The average difference between a student’s estimated political ideology and their network’s average estimated political ideology was 0.66; the standard deviation was 0.99. This distribution is available in Figure 10. This variable represents how different a student’s information network was politically from their own political affiliation. An average value of 0.66 indicates that, on average, students’ information networks were significantly more conservative than they were. This is mostly the result of the average news source in the United States of America, and within this dataset, falling center right politically.
For instance, the most followed outlet in the dataset, the New York Times, rests at -1.54, significantly more liberal than the rest of the outlets and the average political affiliation for the outlets considered. The other most followed outlets, however, are well to the right of center: The Washington Post (0.72), the Associated Press (1.20), CNN (0.97), NPR (1.08), the Wall Street Journal (1.37), and the BBC (0.79). While these outlets may be considered left-leaning or liberal, the reality is that they are well to the right, on average, whereas a more traditionally conservative or right-leaning outlet like Fox News (1.50) or Breitbart (2.02) is exceptionally conservative when compared to the rest of the group.
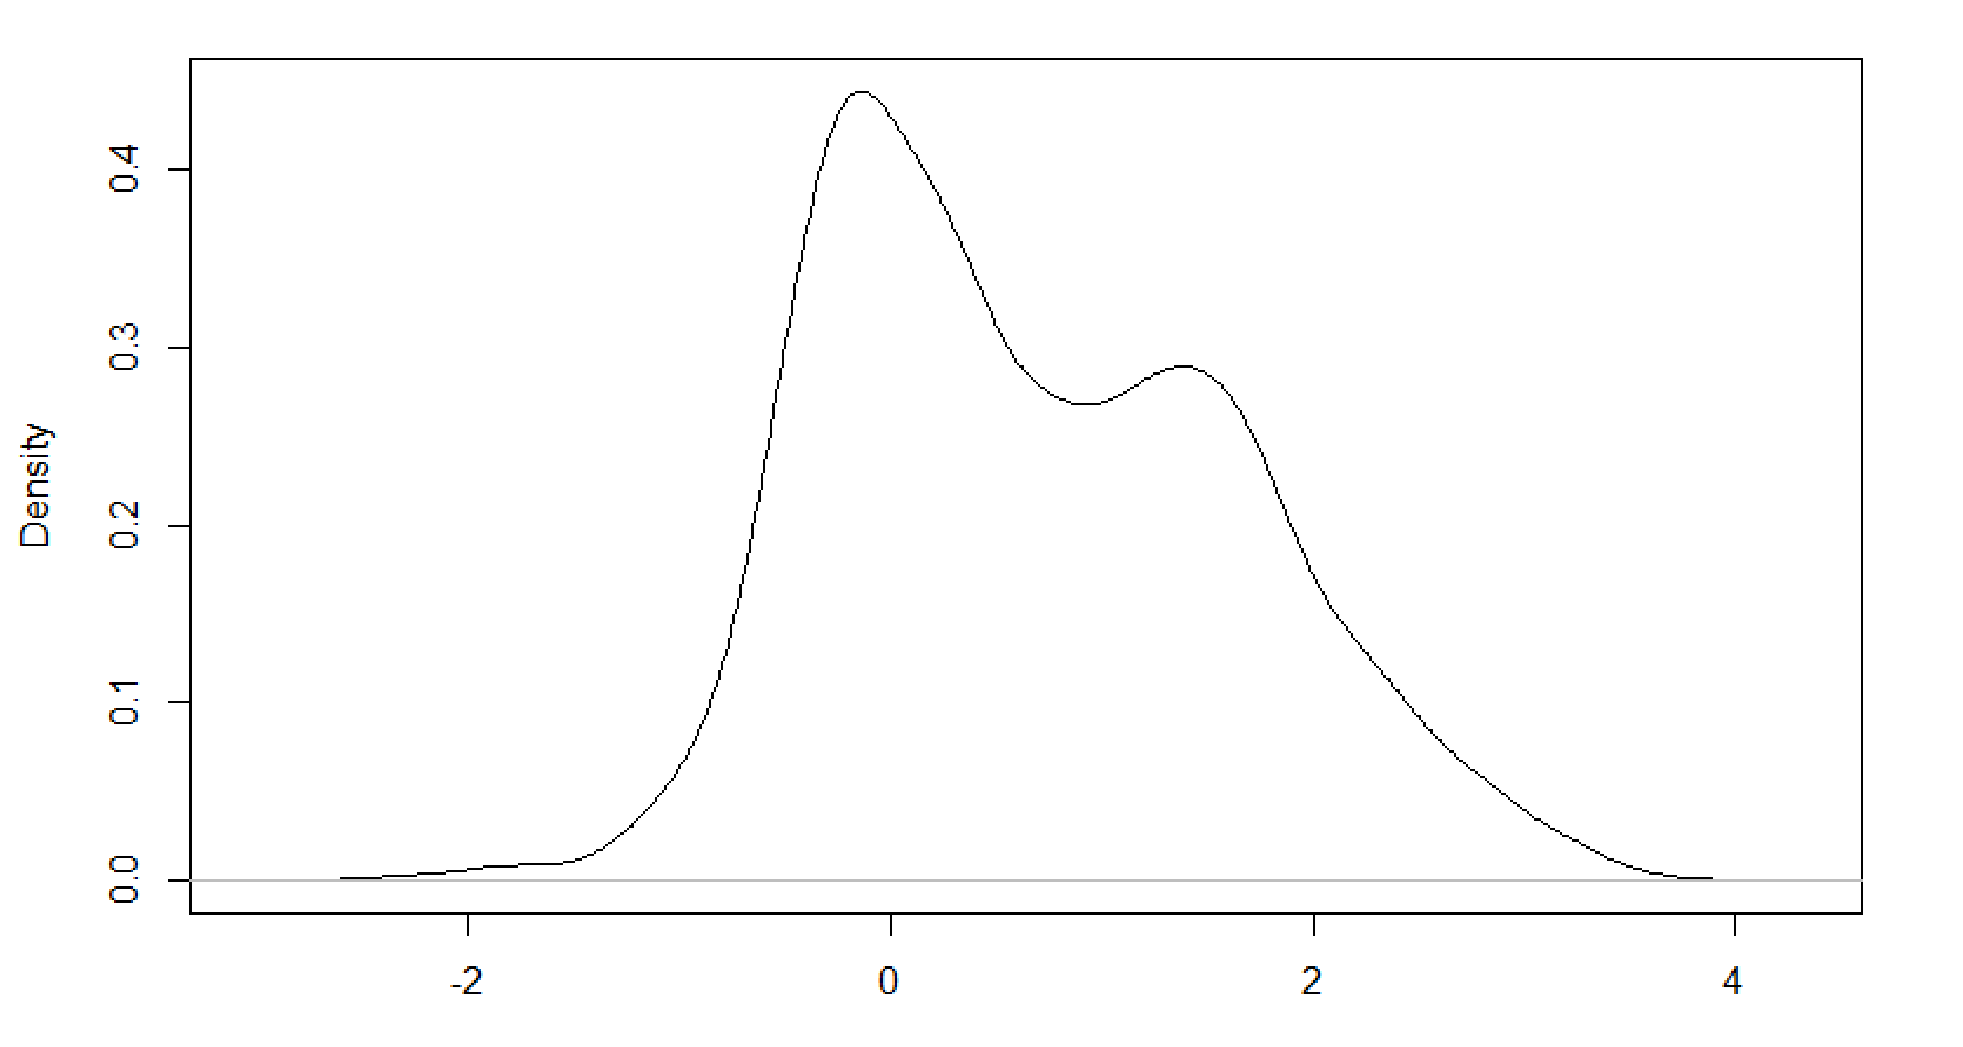
When considered as a group, the students in this sample have fairly similar information networks. They are mostly credible (42.55/64) and most of them are slightly to significantly more conservative than the students themselves. Students’ networks are also ideologically diverse with respect to their distribution (standard deviation, Figure 10) and the average network ideology (Figure 7). Specifically,
Research Question 4: Are the information networks of students on Twitter asymmetric with respect to the quality and reliability of the sources that comprise them?
To answer the final research question regarding informational asymmetry, I ran several descriptive statistical tests and a linear regression model to determine whether the means for subgroups were statistically significant and whether there were any key predictors of increased network quality.
First, I ran two sample t-tests between the average estimated political ideology of all students, conservative students, and liberal students. The average estimated political ideology of conservative students was statistically and significantly different from the mean for all students (t = -14.5, p < 0.001). The average estimated political ideology of liberal students was also statistically and significantly different from the mean for all students (t = 8.6, p < 0.001). This is not surprising, as the sample was fairly moderate and these two subgroups were intentionally calculated outside of the moderate core of the sample.
Second, I ran two sample t-tests between the average network estimated political ideology of all students, conservative students, and liberal students. The average network estimated political ideology of conservative students was statistically and significantly different from the mean for all students (t = -14.8, p < 0.001). The average network estimated political ideology of liberal students was also statistically and significantly different from the mean for all students (t = 8.2, p < 0.001). Conservatives students were much more likely to engage in selective exposure than liberal students, whose information networks were consistently closer to the mean.
Third, I ran two sample t-tests between the average network credibility score of all students, conservative students, and liberal students. The average network credibility score for conservative students was lower than the mean for all students and statistically significant (t = 5.79, p < 0.001). The average network credibility score for liberal students was higher than the average for all students, but was not statistically significant (t = -0.61, p = 0.5386). Conservative students in this sample are curating, exposing themselves to, and consuming, on average, a worse quality of information than their peers.
Finally, I ran a linear regression model to assess whether there were any network-level predictors of information network quality. The final model included the dependent variable average network credibility score and covariates student estimated political ideology, each student’s average network estimated political ideology, the size of their network, and the standard deviation of the political ideologies of outlets in their network.
All covariates in the model were statistically significant for an alpha level of 0.001. The model output is available in Table 1. While all covariates were statistically significant, the adjusted R-squared of the overall model was very low (0.08), suggesting that there are additional factors influencing network credibility and that these features, though significant, do not describe the majority of variance in the sample.
| Covariate | Regression Coefficient |
|---|---|
| Student’s Estimated Political Ideology | -0.637 |
| Average Network Estimated Political Ideology | -1.012 |
| Network Size | 0.0347 |
| Standard Deviation of Average Network Estimated Political Ideology (Diversity of Network) | 1.827 |
The linear regression model (n = 2205) indicates that there are a few key student-level influences on network credibility. First, for every one unit increase in a student’s estimated political ideology, there is a -0.637 change in the average credibility of their information network. Second, for every one unit increase in the average estimated political ideology of their network there is a -1.012 change in the average credibility of their information network. There is a minor positive change to average network credibility as the size of a student’s network increases and, finally, there is a substantial increase in average network credibility as their information network becomes more politically and ideologically diverse.
Discussion
The snapshot presented in this report of 2205 students’ information networks is not inconsistent with previous research conducted on the general populace. First, it is clear that conservative students are more likely to engage in selective exposure and political homophily than their liberal peers. As Colleoni and peers (2014) indicated in their study of the general population on Twitter, this may result in tighter in-group clustering. Within this study, tighter in-group clustering may also lead to a statistically significant decrease in average network credibility, suggesting that increasing partisanship towards the right worsens the information students are exposed to. Similarly, as the average estimated political ideology of a network became more conservative, the average network credibility dropped suggesting that conservative outlets may be, on average, less credible than more middle-of-the-road, centrist, or liberal outlets. This is consistent with Price and Kaufhold’s (2019) suggestion that people diversify their information consumption along ideological lines. This suggestion is also supported by the reality that the diversity of an information network was statistically significantly associated with an increase to the network’s average credibility.
Implications
Higher education is often considered a public good or a system which provides a public good. While the nature and use of higher education has shifted over time (Labaree, 1997), general outcomes like critical thinking, literacy, and the ability for graduates to participate as informed citizens have remained. Unfortunately, contemporary students may be graduating and entering the general public armed with the perception that they are capable of parsing information and participating in informed debate and decision making without the actual skills to support this. The rest of the general public may similarly be operating under the delusion that they are more digitally literate than they actually are (Wineburg & McGrew, 2019). Research abounds demonstrating that students are bad at evaluating the credibility of their sources (Julien & Barker, 2009; McGrew et al., 2019; Wineburg & McGrew, 2019). These studies, however, are limited due to their experimental nature (i.e. students perform poorly in experimental conditions with controlled environments and standardized tasks, but their everyday digital literacy and approach to similar tasks likely differs during their regular life). This study empirically assessed where today’s students are in terms of their navigation of the digital media environment, their application of critical thinking to information network curation, and their subsequent media exposure. This study showed that, while political polarization certainly exists, it may be less widespread than it seems, at least when it comes to the news and information students are exposing themselves to. That being said, there are some clear patterns within this data that prompt interventions and suggestions in the interest of promoting informed civic engagement.
First, institutions of higher education should spend more time promoting critical thinking and information evaluation as part of their core curricula. Currently, interventions like lateral reading (Wineburg & McGrew, 2019) are not being leveraged to their full potential. Drawn from the work of fact checkers and compared against undergraduate students and faculty, Wineburg and McGrew (2019) describe lateral reading as “reading less to learn more” (p. 1”). Specifically, lateral reading entails leaving whatever you are reading (a news article, a blog post, etc.) and seeking out alternative sources to corroborate the information provided in lieu of vertical reading, or reading the page top to bottom in an effort to discern its credibility. In their study, Wineburg and McGrew saw that professional fact checkers, who were far more consistent when it came to detecting inaccuracies, simply left the page and opened new ones to verify if what they were reading was true and useful whereas students and faculty, for the most part, read as much of the initial source as possible before rendering a decision. Institutions interested in maximizing both civic engagement and the quality of information students arm themselves with when they are civically engaging should consider hosting workshops to teach students to engaging in lateral reading practices, read less to learn more, and more critically, and quickly, evaluate the information they are exposing themselves to and consuming.
Second, students, staff, and faculty should internalize the reality that a diverse media and information diet is crucial to quality information, but that there is also clear asymmetry when it comes to achieving that diversity. Specifically, students, staff, and faculty should be encouraged to question the sources they get their information from and how those sources may be biased in one direction or another. In practice, this might mean having candid conversations about the difference in reporting practices between a highly partisan news outlet (such as Mother Jones or Jacobin on the left and Breitbart or the New American on the right) and one that is more middle-of-the-road (such as Reuters). Similarly, a greater focus should be placed upon identifying, and emphasizing, that the majority of news in the United States of America is center right and that there is not a partisan monopoly on information.
Finally, more work needs to be done to understand in more detail the actual information pathways students are pursuing when it comes to finding, selecting, and consuming information. While this study identifies information sources that students are theoretically exposing themselves to, future work should consider student interaction with information sources, including further investigation into how students seek out and use information in both academic and social settings and more pointed intervention programming that teaches students how to do this and why it is important. While some of this is already happening in elective courses (such as Education courses that focus on research methods and teach students about how to access information from academic journals), much of the intervention necessary is voluntary (i.e. seeking out help from a librarian) when it could be compulsory and built into existing curricula and even all-student activities like orientation.
References3
Adair, J. K., Colegrove, K. S. S., & McManus, M. E. (2017). How the word gap argument negatively impacts young children of Latinx immigrants' conceptualizations of learning. Harvard Educational Review, 87(3), 309-334.
Addy, J. M. (2020). The art of the real: fact checking as information literacy instruction. Reference Services Review.
Al Zamal, F., Liu, W., & Ruths, D. (2012, May). Homophily and latent attribute inference: Inferring latent attributes of twitter users from neighbors. In Sixth International AAAI Conference on Weblogs and Social Media.
Anthony, B., & Jewell, J. R. (2017). Students’ perceptions of using Twitter for learning in social work courses. Journal of Technology in Human Services, 35(1), 38-48.
Arceneaux, P. C., & Dinu, L. F. (2018). The social mediated age of information: Twitter and Instagram as tools for information dissemination in higher education. New Media & Society, 20(11), 4155-4176.
Avins, A. (1965). The Fifteenth Amendment and Literacy Tests: The Original Intent. Stan. L. Rev., 18, 808.
Bakshy, E., Messing, S., & Adamic, L. A. (2015). Exposure to ideologically diverse news and opinion on Facebook. Science, 348(6239), 1130-1132.
Barberá, P. (2015). Birds of the same feather tweet together: Bayesian ideal point estimation using Twitter data. Political analysis, 23(1), 76-91.
Barberá, P., Jost, J. T., Nagler, J., Tucker, J. A., & Bonneau, R. (2015). Tweeting from left to right: Is online political communication more than an echo chamber?. Psychological science, 26(10), 1531-1542.
Benenson, J., & Bergom, I. (2019). Voter Participation, Socioeconomic Status, and Institutional Contexts in Higher Education. The Review of Higher Education, 42(4), 1665-1688.
Bennett, W. L., & Pfetsch, B. (2018). Rethinking political communication in a time of disrupted public spheres. Journal of Communication, 68(2), 243-253.
Bennion, E. A., & Nickerson, D. W. (2021). Decreasing Hurdles and Increasing Registration Rates for College Students: An Online Voter Registration Systems Field Experiment. Political Behavior, 1-22.
Bimber, B., & Gil de Zúñiga, H. (2020). The unedited public sphere. New Media & Society, 22(4), 700-715.
Binder, A. J., & Wood, K. (2014). Becoming right: How campuses shape young conservatives (Vol. 54). Princeton University Press.
Birnbaum, R. (1983). Value of different kinds of colleges. In J. L. Bess (Ed.), Foundations of American higher education. Needham Heights, MA: Simon & Schuster.
Blank, G. (2017). The digital divide among Twitter users and its implications for social research. Social Science Computer Review, 35(6), 679-697.
Bowen, H.R. (1977). Investing in learning: The individual and social value of American higher education. San Francisco, CA: Jossey-Bass. (Chapter, “Goals: the intended outcomes of higher education”)
Bowyer, B., & Kahne, J. (2020). The digital dimensions of civic education: Assessing the effects of learning opportunities. Journal of Applied Developmental Psychology, 69, 101162.
Boyte, H., & Hollander, E. (1999). Wingspread declaration on the civic responsibilities of research universities. Campus Compact.
Bradburn, N. M., Sudman, S., Blair, E., & Stocking, C. (1978). Question threat and response bias. Public opinion quarterly, 42(2), 221-234.
Braine, G. (2002). Academic literacy and the nonnative speaker graduate student. Journal of English for academic purposes, 1(1), 59-68.
Brandt, D. (2009). Literacy and learning: Reflections on writing, reading, and society. John Wiley & Sons.
Bråten, I., Strømsø, H. I., & Andreassen, R. (2016). Sourcing in professional education: Do text factors make any difference?. Reading and Writing, 29(8), 1599-1628.
Breakstone, J., McGrew, S., Smith, M., Ortega, T., & Wineburg, S. (2018). Why we need a new approach to teaching digital literacy. Phi Delta Kappan, 99(6), 27-32.
Brem, S. K., Russell, J., & Weems, L. (2001). Science on the Web: Student evaluations of scientific arguments. Discourse Processes, 32, 191−213.
Bright, J. (2018). Explaining the emergence of political fragmentation on social media: The role of ideology and extremism. Journal of Computer-Mediated Communication, 23(1), 17-33.
Brundidge, J. (2010). Encountering “difference” in the contemporary public sphere: The contribution of the Internet to the heterogeneity of political discussion networks. Journal of Communication, 60(4), 680-700.
Chaiken, S. (1980). Heuristic versus systematic processing and the use of source versus message cues in persuasion. Journal of Personality and Social Psychology, 39, 752–766.
Chaiken, S., Giner-Sorolla, R., & Chen, S. (1996). Beyond accuracy: Defense and impression motives in heuristic and systematic information processing. In P. M. Gollwitzer & J. A. Bargh (Eds.), The psychology of action: Linking cognition and motivation to behavior (p. 553–578). The Guilford Press.
Chaiken, S., & Ledgerwood, A. (2011). A theory of heuristic and systematic information processing. Handbook of theories of social psychology: Volume one, 246-166.
Chen, S., & Chaiken, S. (1999). The heuristic-systematic model in its broader context. In S. Chaiken & Y. Trope (Eds.), Dual-process theories in social psychology (p. 73–96). The Guilford Press.
Coiro, J., Knobel, M., Lankshear, C., & Leu, D. J. (2008). Central issues in new literacies and new literacies research. Handbook of research on new literacies, 1-21.
Coiro, J., Knobel, M., Lankshear, C., & Leu, D. J. (Eds.). (2014). Handbook of research on new literacies. Routledge.
Colleoni, E., Rozza, A., & Arvidsson, A. (2014). Echo chamber or public sphere? Predicting political orientation and measuring political homophily in Twitter using big data. Journal of communication, 64(2), 317-332.
Crawford, J. (2000). At war with diversity: US language policy in an age of anxiety (Vol. 25). Multilingual matters.
Cunningham, A. E., & Stanovich, K. E. (1997). Early reading acquisition and its relation to reading experience and ability 10 years later. Developmental psychology, 33(6), 934.
Cunningham, A. E., & Stanovich, K. E. (1998). What reading does for the mind. American educator, 22, 8-17.
Dennen, V. P., Choi, H., & Word, K. (2020). Social media, teenagers, and the school context: a scoping review of research in education and related fields. Educational Technology Research and Development, 68(4), 1635-1658.
Dickinson, D. K., & Tabors, P. O. (2001). Beginning literacy with language: Young children learning at home and school. Paul H Brookes Publishing.
Echols, L. D., West, R. F., Stanovich, K. E., & Zehr, K. S. (1996). Using children's literacy activities to predict growth in verbal cognitive skills: A longitudinal investigation. Journal of educational psychology, 88(2), 296.
Ediger, D., Jiang, K., Riedy, J., Bader, D. A., Corley, C., Farber, R., & Reynolds, W. N. (2010, September). Massive social network analysis: Mining twitter for social good. In 2010 39th International Conference on Parallel Processing (pp. 583-593). IEEE.
Ehrlich, T. (Ed.). (2000). Civic responsibility and higher education. Greenwood Publishing Group.
Falk-Ross, F., & Evans, B. (2014). Word Games: Content Area Teachers' Use of Vocabulary Strategies to Build Diverse Students' Reading Competencies. Language and Literacy Spectrum, 24, 84-100.
Flanagin, A. J., & Metzger, M. J. (2007). The role of site features, user attributes, and information verification behaviors on the perceived credibility of web-based information. New media & society, 9(2), 319-342.
Flanagin, A. J., & Metzger, M. J. (2020). Source Credibility. The International Encyclopedia of Media Psychology, 1-5.
Flanagin, A. J., Winter, S., & Metzger, M. J. (2020). Making sense of credibility in complex information environments: The role of message sidedness, information source, and thinking styles in credibility evaluation online. Information, Communication & Society, 23(7), 1038-1056.
Fogg, B. J. (2002). Persuasive technology: using computers to change what we think and do. Ubiquity.
Fogg, B. J. (2003, April). Prominence-interpretation theory: Explaining how people assess credibility online. In CHI'03 extended abstracts on human factors in computing systems (pp. 722-723).
Foley, B. (2017, December 31). Spread of fake news prompts literacy efforts in schools. PBS New Hour. Retrieved from https://www.pbs.org/newshour/education/spread-of-fake-news-prompts-literacy-efforts-in-schools
Freebody, P. (2007). Literacy education in school: Research perspectives from the past, for the future.
Freeman, K. S., & Spyridakis, J. H. (2004). An examination of factors that affect the credibility of online health information. Technical communication, 51(2), 239-263.
Fuller, J. (2010). What is happening to news: The information explosion and the crisis in journalism. University of Chicago Press.
Furgione, B., Evans, K., Jahani, S., & Russell III, W. B. (2018). Divided we test: Proficiency rate disparity based on the race, gender, and socioeconomic status of students on the Florida US History End-of-Course Assessment. Journal of Social Studies Education Research, 9(3), 62-96.
Furnham, A. (1986). Response bias, social desirability and dissimulation. Personality and individual differences, 7(3), 385-400.
Garrett, R. K. (2009). Echo chambers online?: Politically motivated selective exposure among Internet news users. Journal of Computer-Mediated Communication, 14(2), 265-285.
Gaziano, C., & McGrath, K. (1986). Measuring the concept of credibility. Journalism quarterly, 63(3), 451-462.
Gleason, B. (2018). Thinking in hashtags: exploring teenagers’ new literacies practices on Twitter. Learning, Media and Technology, 43(2), 165-180.
Goodman, L. A. (1961). Snowball sampling. The annals of mathematical statistics, 148-170.
Gottfried, J., & Shearer, E. (2016). News use across social media platforms 2016.
Gross, M., & Latham, D. (2012). What's skill got to do with it?: Information literacy skills and self‐views of ability among first‐year college students. Journal of the American Society for Information Science and Technology, 63(3), 574-583.
Gruenbaum, E. A. (2012). Common literacy struggles with college students: Using the reciprocal teaching technique. Journal of College Reading and Learning, 42(2), 109-116.
Guath, M. (2020). Students Assessing Digital News and Misinformation. In Disinformation in Open Online Media: Second Multidisciplinary International Symposium, MISDOOM 2020, Leiden, The Netherlands, October 26-27, 2020, Proceedings (Vol. 12259, p. 63). Springer Nature.
Gutmann, A. (1987). Democratic education. Princeton, NJ: Princeton University Press. (Chapter 6, “The purposes of higher education”)
Gutmann, A., & Ben‐Porath, S. (2014). Democratic education. The encyclopedia of political thought, 863-875.
Gutmann, A., & Thompson, D. F. (1998). Democracy and disagreement. Harvard University Press.
Hargittai, E., Fullerton, L., Menchen-Trevino, E., & Thomas, K. Y. (2010). Trust online: Young adults' evaluation of web content. International journal of communication, 4, 27.
Havey, N. (2020a). Partisan Public Health: How Does Political Ideology Influence Support for COVID-19 Related Misinformation? Journal of Computational Social Science. (2020). https://doi.org/10.1007/s42001-020-00089-2
Havey N. F. (2020b) “Radicalized on Campus? (Un)Coded Whiteness as Campus Social Movement”, Journal of Critical Thought and Praxis 10(1). https://doi.org/10.31274/jctp.11566
Havey, N. (2021). Automating Online Credibility Assessments: Problems and Future Directions. Working paper.
Himelboim, I., McCreery, S., & Smith, M. (2013). Birds of a feather tweet together: Integrating network and content analyses to examine cross-ideology exposure on Twitter. Journal of computer-mediated communication, 18(2), 154-174.
Hong, T. (2006). The influence of structural and message features on web site credibility. Journal of the Association for Information Science and Technology, 57, 114–127.
Hope, E. C., Brugh, C. S., & Nance, A. (2019). In search of a critical stance: Applying qualitative research practices for critical quantitative research in psychology. Community Psychology in Global Perspective, 5(2), 63-69.
Howe, E. C., & Fosnacht, K. (2017). Promoting democratic engagement during college: Looking beyond service-learning. Journal of College and Character, 18(3), 155-170.
Iyengar, S., & Hahn, K. S. (2009). Red media, blue media: Evidence of ideological selectivity in media use. Journal of communication, 59(1), 19-39.
Johnson, E. J. (2015). Debunking the “language gap”. Journal for Multicultural Education.
Jost, J. T. (2017). Ideological asymmetries and the essence of political psychology. Political psychology, 38(2), 167-208.
Julien, H., & Barker, S. (2009). How high-school students find and evaluate scientific information: A basis for information literacy skills development. Library & Information Science Research, 31(1), 12-17.
Jurkowitz M (2014) Small digital news sites: young, lean and local. Available at: http://www. pewresearch.org/fact-tank/2014/04/10/small-digital-news-sites-young-lean-and-local
Kaestle, C. F. (1985). Chapter 1: The history of literacy and the history of readers. Review of research in education, 12(1), 11-53.
Kaestle, C. F., & Damon-Moore, H. (1991). Literacy in the United States: Readers and reading since 1880. Yale University Press.
Kahne, J., & Bowyer, B. (2017). Educating for democracy in a partisan age: Confronting the challenges of motivated reasoning and misinformation. American Educational Research Journal, 54(1), 3-34.
Kahneman, D. (2011). Thinking, fast and slow. Macmillan.
Kearney, M. W. (2019). rtweet: Collecting and analyzing Twitter data. Journal of Open Source Software, 4(42), 1829.
Kearns, L. L. (2016). The construction of ‘illiterate’and ‘literate’youth: The effects of high-stakes standardized literacy testing. Race Ethnicity and Education, 19(1), 121-140.
Kissel, A. (2020). Campus Free Speech: A Cultural Approach. Sketching a New Conservative Education Agenda. American Enterprise Institute.
Knobloch-Westerwick, S., Mothes, C., & Polavin, N. (2017). Confirmation bias, ingroup bias, and negativity bias in selective exposure to political information. Communication Research, 0093650217719596.
Kwak, H., Lee, C., Park, H., & Moon, S. (2010, April). What is Twitter, a social network or a news media?. In Proceedings of the 19th international conference on World wide web (pp. 591-600).
Labaree, D. F. (1997). How to succeed in school without really learning: The credentials race in American education. Yale University Press.
Ladson‐Billings, G. (1992). Reading between the lines and beyond the pages: A culturally relevant approach to literacy teaching. Theory into practice, 31(4), 312-320.
Lankshear, C., McLaren, P. L., & McLaren, P. (Eds.). (1993). Critical literacy: Politics, praxis, and the postmodern. SUNY Press.
Lazarsfeld, P., & Merton, R. K. (1954). Friendship as a social process: A substantive and methodological analysis. In M. Berger, T. Abel, & C. H. Page (Eds.), Freedom and control in modern society (pp. 18-66). New York, NY: Van Nostrand.
Leeder, C. (2019). How college students evaluate and share “fake news” stories. Library & Information Science Research, 41(3), 100967.
Leibowitz, A. H. (1969). English literacy: Legal sanction for discrimination. Notre Dame Law., 45, 7.
Leu, D. J., Kinzer, C. K., Coiro, J. L., & Cammack, D. W. (2004). Toward a theory of new literacies emerging from the Internet and other information and communication technologies. Theoretical models and processes of reading, 5(1), 1570-1613.
Licari, P. R. (2020). Sharp as a fox: Are Foxnews. com visitors less politically knowledgeable?. American Politics Research, 48(6), 792-806.
Livingstone, S., & Helsper, E. (2010). Balancing opportunities and risks in teenagers’ use of the internet: The role of online skills and internet self-efficacy. New media & society, 12(2), 309-329.
May, S. (2012). Language and minority rights: Ethnicity, nationalism and the politics of language. Routledge.
Mcdougall, J. (2019). Media literacy versus fake news: critical thinking, resilience and civic engagement. Media Studies, 10(19), 29-45.
McCormick, T. H., Lee, H., Cesare, N., Shojaie, A., & Spiro, E. S. (2017). Using Twitter for demographic and social science research: Tools for data collection and processing. Sociological methods & research, 46(3), 390-421.
McGrew, S., Smith, M., Breakstone, J., Ortega, T., & Wineburg, S. (2019). Improving university students’ web savvy: An intervention study. British Journal of Educational Psychology, 89(3), 485-500.
Menken, K. (2008). English learners left behind: Standardized testing as language policy (Vol. 65). Multilingual Matters.
Meola, M. (2004). Chucking the checklist: A contextual approach to teaching undergraduates Web-site evaluation. portal: Libraries and the Academy, 4(3), 331-344.
Metzger, M. J. (2007). Making sense of credibility on the Web: Models for evaluating online information and recommendations for future research. Journal of the American society for information science and technology, 58(13), 2078-2091.
Metzger, M. J., Flanagin, A. J., & Medders, R. B. (2010). Social and heuristic approaches to credibility evaluation online. Journal of communication, 60(3), 413-439.
Metzger, M. J., Hartsell, E. H., & Flanagin, A. J. (2020). Cognitive dissonance or credibility? A comparison of two theoretical explanations for selective exposure to partisan news. Communication Research, 47(1), 3-28.
Mihailidis, P., & Thevenin, B. (2013). Media literacy as a core competency for engaged citizenship in participatory democracy. American Behavioral Scientist, 57(11), 1611-1622.
Miller, M., & Veatch, N. (2010). Teaching literacy in context: Choosing and using instructional strategies. The Reading Teacher, 64(3), 154-165.
Miller, W., & Gunnels, K. (2020). Engagement in Higher Education: Building Civil Society through Campus Activism. In Civil Society and Social Responsibility in Higher Education: International Perspectives on Curriculum and Teaching Development. Emerald Publishing Limited.
Morgan, W. (1997). Critical literacy in the classroom: The art of the possible. Psychology Press.
Munger, K. (2020). All the news that’s fit to click: The economics of clickbait media. Political Communication, 37(3), 376-397.
Myers, S. A., Sharma, A., Gupta, P., & Lin, J. (2014, April). Information network or social network? The structure of the Twitter follow graph. In Proceedings of the 23rd International Conference on World Wide Web (pp. 493-498).
Nam, H. H., Jost, J. T., & Van Bavel, J. J. (2013). Not for all the tea in China!. Political ideology and the avoidance of dissonance-arousing situations. PLoS One, 8(4).
National Association for Media Literacy Education (NAMLE). (2021). Retrieved 15 February 2021, from https://namleconference.net/2021conference/theme/
Noble, S. U. (2018). Algorithms of oppression: How search engines reinforce racism. NYU Press.
Nygren, T., Brounéus, F., & Svensson, G. (2019). Diversity and Credibility in Young People's News Feeds: A Foundation for Teaching and Learning Citizenship in a Digital Era. Journal of Social Science Education, 18(2), 87-109.
O'Brien, H. L., & Symons, S. (2007). The information behaviors and preferences of undergraduate students. Research Strategies, 20, 409−423.
O’Connor, K. M., & McEwen, L. (2021). Real World Learning Through Civic Engagement: Principles, Pedagogies and Practices. In Applied Pedagogies for Higher Education (pp. 63-89). Palgrave Macmillan, Cham.
Ostenson, J. (2014). Reconsidering the checklist in teaching Internet source evaluation. portal: Libraries and the Academy, 14(1), 33-50.
Park, J. J. (2018). Race on campus: Debunking myths with data. Harvard Education Press.
Passy, F., & Monsch, G. A. (2014). Do social networks really matter in contentious politics?. Social Movement Studies, 13(1), 22-47.
Pearson, G. D., & Knobloch-Westerwick, S. (2018). Perusing pages and skimming screens: Exploring differing patterns of selective exposure to hard news and professional sources in online and print news. New Media & Society, 20(10), 3580-3596.
Pearson, G. (2020). Sources on social media: Information context collapse and volume of content as predictors of source blindness. New Media & Society, 1461444820910505.
Pennycook, G., & Rand, D. G. (2019). Fighting misinformation on social media using crowdsourced judgments of news source quality. Proceedings of the National Academy of Sciences, 116(7), 2521-2526.
Petty, R. E., & Cacioppo, J. T. (1981). Attitudes and persuasion: Classic and contemporary approaches. Dubuque, IA: Brown.
Petty, R. E., & Cacioppo, J. T. (1984). Source factors and the elaboration likelihood model of persuasion. ACR North American Advances.
Petty, R. E., & Cacioppo, J. T. (1986). The elaboration likelihood model of persuasion. In Communication and persuasion (pp. 1-24). Springer, New York, NY.
Pirolli, P. (2005). Rational analyses of information foraging on the Web. Cognitive Science, 29, 343–373.
Pirolli, P. (2007). Information foraging theory: Adaptive interaction with information. Oxford University Press.
Pirolli, P., & Card, S. (1999). Information foraging. Psychological Review, 106(4), 643–675. https://doi.org/10.1037/0033-295X.106.4.643
Price, D. M., & Kaufhold, K. (2019). Bordering on Empathy: The Effect of Selective Exposure and Border Residency on Immigration Attitudes. Journal of Broadcasting & Electronic Media, 63(3), 494-511.
Ribeiro, M. H., Calais, P. H., Almeida, V. A., & Meira Jr, W. (2017). " Everything I Disagree With is# FakeNews": Correlating Political Polarization and Spread of Misinformation. arXiv preprint arXiv:1706.05924.
Ricento, T. K., & Hornberger, N. H. (1996). Unpeeling the onion: Language planning and policy and the ELT professional. Tesol Quarterly, 30(3), 401-427.
Riddle, S., & Apple, M. W. (Eds.). (2019). Re-imagining education for democracy. Routledge.
Romeo, R. R., Leonard, J. A., Robinson, S. T., West, M. R., Mackey, A. P., Rowe, M. L., & Gabrieli, J. D. (2018). Beyond the 30-million-word gap: Children’s conversational exposure is associated with language-related brain function. Psychological science, 29(5), 700-710.
Sharon, A. J., & Baram‐Tsabari, A. (2020). Can science literacy help individuals identify misinformation in everyday life?. Science Education, 104(5), 873-894.
Shearer, E. (2018.). “Social media outpaces print newspapers in the U.S. as a news source.” Pew Research Center. https://www.pewresearch.org/fact-tank/2018/12/10/social-media-outpacesprint-newspapers-in-the-u-s-as-a- n ews-source/
Spitzer, K. L., Eisenberg, M. B., & Lowe, C. A. (1998). Information Literacy: Essential Skills for the Information Age. Information Resources Publications, Syracuse University, 4-194 Center for Science and Technology, Syracuse, NY 13244-4100.
Stedman, C. (2020). IRL: Finding Realness, Meaning, and Belonging in Our Digital Lives. Broadleaf Books.
Steinert-Threlkeld, Z. C. (2018). Twitter as data. Cambridge University Press.
Stepanyan, K., Borau, K., & Ullrich, C. (2010, July). A social network analysis perspective on student interaction within the twitter microblogging environment. In 2010 10th IEEE international conference on advanced learning technologies (pp. 70-72). IEEE.
Stern, C., West, T. V., Jost, J. T., & Rule, N. O. (2014). “Ditto heads” do conservatives perceive greater consensus within their ranks than liberals?. Personality and Social Psychology Bulletin, 40(9), 1162-1177.
Stoddard, J. (2014). The need for media education in democratic education. Democracy and Education, 22(1), 4.
Stroud, N. J. (2010). Polarization and partisan selective exposure. Journal of communication, 60(3), 556-576.
Tatum, B. D. (2017). Why are all the Black kids sitting together in the cafeteria?: And other conversations about race. Basic Books.
Thelin, J. R. (2011). A history of American higher education. JHU Press.
Thomas, S. L. (2000). Ties that bind: A social network approach to understanding student integration and persistence. The Journal of Higher Education, 71(5), 591-615.
Trachsel, M. C. B. (1989). The history of college entrance examinations in English: A record of academic assumptions about literacy.
Tuominen, K., Savolainen, R., & Talja, S. (2005). Information literacy as a sociotechnical practice. The Library Quarterly, 75(3), 329-345.
Wathen, C. N., & Burkell, J. (2002). Believe it or not: Factors influencing credibility on the Web. Journal of the American society for information science and technology, 53(2), 134-144.
Watson, E. (2020). # Education: The Potential Impact of Social Media and Hashtag Ideology on the Classroom. Research in Social Sciences and Technology, 5(2), 40-56.
Weeks, B. E., Kim, D. H., Hahn, L. B., Diehl, T. H., & Kwak, N. (2019). Hostile Media Perceptions in the Age of Social Media: Following Politicians, Emotions, and Perceptions of Media Bias. Journal of Broadcasting & Electronic Media, 63(3), 374-392.
Wineburg, S., & McGrew, S. (2019). Lateral Reading and the Nature of Expertise: Reading Less and Learning More When Evaluating Digital Information. Teachers College Record, 121(11), n11.
Wineburg, S. S., Martin, D., & Monte-Sano, C. (2012). Reading like a historian: Teaching literacy in middle and high school history classrooms. Teachers College Press.
Wray, D., Fox, R., Medwell, J., & Poulson, L. (2002). Teaching literacy effectively in the primary school. Psychology Press.
Appendix 1
| Twitter User ID | Outlet / Name | EPI | Credibility Score |
|---|---|---|---|
| 538politics | 538 Politics | 0.557396 | 38.21 |
| ABC | ABC News | 0.329786 | 48.29 |
| abcnews | ABC News | 0.733631 | 48.29 |
| AFP | Agence France-Presse | 1.022981 | 47.97 |
| afpfr | Agence France-Presse | 1.022981 | 47.97 |
| ajc | Atlanta Journal-Constitution | 0.99905 | 45.96 |
| AJENews | Al Jazeera | -0.21633 | 46.28 |
| AJEnglish | Al Jazeera | -1.01959 | 46.28 |
| alfranken | The Al Franken Podcast | -1.5658 | 33.63 |
| ALNewsNetwork | Alabama News | 0.811984 | 47.22 |
| AlterNet | AlterNet | -1.56037 | 24.21 |
| amconmag | The American Conservative | 1.341312 | 32.43 |
| AmericanThinker | American Thinker | 1.789981 | 20.01 |
| AmerIndependent | American Independent | -0.3101 | 39.38 |
| amspectator | The American Spectator | 1.568222 | 18.61 |
| AP | The Associated Press | 1.206434 | 51.37 |
| AppleNews | Apple News Today | 0.899744 | 46.26 |
| ArmchairExpPod | Armchair Expert | -1.18858 | 39.21 |
| ArmyTimes | Army Times | -2.30035 | 48.03 |
| arstechnica | ARS Technica | -1.19898 | 46.32 |
| ASlavitt | In the Bubble with Andy Slavitt | -1.72348 | 44.83 |
| ATLBlackStar | Atlanta Black Star | -0.64327 | 45.56 |
| axios | Axios | 1.078187 | 48.15 |
| AxiosReCap | Axios Today | 1.163997 | 44.69 |
| azcentral | Arizona Central | 1.012451 | 44.31 |
| baltimoresun | Baltimore Sun | 0.353372 | 47.1 |
| BBCBreaking | BBC | 0.529514 | 48.38 |
| BBCWorld | BBC World | 0.796901 | 48.38 |
| BearingArmsCom | Bearing Arms | 1.685754 | 25.9 |
| beforeitsnews | Before It's News | 1.447207 | 5.23 |
| benfergusonshow | The Ben Ferguson Pod | 1.473155 | 8.9 |
| benshapiro | The Ben Shapiro Show | 1.850335 | 29.48 |
| BGOV | Bloomberg Government | 1.042919 | 47.17 |
| billboard | Billboard | -0.78799 | 41.06 |
| BostonGlobe | Boston Globe | 0.836247 | 45.3 |
| bostonherald | Boston Herald | 1.022836 | 41.15 |
| BreitbartNews | Breitbart | 2.025166 | 27.51 |
| BreitbartTech | Breitbart Tech | 2.338333 | 27.51 |
| BreneBrown | Unlocking Us with Brene Brown | -1.32957 | 30.28 |
| BulwarkOnline | The Bulwark | 2.057575 | 33.77 |
| business | Bloomberg News | 0.812297 | 47.56 |
| BusinessInsider | Business Insider | 0.842065 | 44.05 |
| BuzzFeed | BuzzFeed | 0.116836 | 45.27 |
| CBNNews | Christian Broadcasting Network | 0.120134 | 35.55 |
| CBNOnline | Christian Broadcasting Network | 1.594766 | 35.55 |
| CBS | CBS News | 1.298063 | 49.48 |
| CBSLA | CBS LA | 0.599713 | 49.48 |
| CBSNews | CBS News | 0.561052 | 49.48 |
| CFO | CFO | 0.63728 | 47.38 |
| CharlieKirk11 | The Charlie Kirk Show | 1.021501 | 7.99 |
| chicagotribune | Chicago Tribune | 1.483578 | 47.35 |
| CNBC | CNBC | 0.784996 | 46.98 |
| CNET | CNET | 0.533933 | 46.47 |
| CNETNews | CNET | 0.739251 | 46.47 |
| CNN | CNN | 0.973557 | 43.67 |
| cnnbrk | CNN Breaking News | 0.385415 | 43.67 |
| CollegeFix | The College Fix | 1.787595 | 39.4 |
| coloradodaily | Colorado Daily | -0.51993 | 45.37 |
| commondreams | Common Dreams | -1.58749 | 38.38 |
| Consortiumnews | Consortium News | -0.37114 | 26.55 |
| CR | Conservative Review | 1.874443 | 16.92 |
| crookedmedia | Crooked Media | -2.24414 | 23.49 |
| crooksandliars | Crooks and Liars | 0.52978 | 25.95 |
| csmonitor | Christian Science Monitor | 0.953158 | 45.42 |
| CTmagazine | Christianity Today | 1.105942 | 45.56 |
| curaffairs | Current Affairs | 1.209213 | 33.72 |
| DailyCaller | Daily Caller | 1.378049 | 25.67 |
| dailydot | Daily Dot | 0.580197 | 36.71 |
| dailykos | Daily Kos | -2.06565 | 25.34 |
| DailyMail | Daily Mail | 0.42426 | 31.11 |
| DailySignal | Daily Signal | 1.510382 | 27.2 |
| dallasnews | Dallas Morning News | 1.1561 | 44.44 |
| davidaxelrod | The Axe Files (with David Axelrod) | 0.482316 | 41.94 |
| dcexaminer | Washington Examiner | 1.326815 | 34.91 |
| DEADLINE | Deadline | 1.009075 | 41.12 |
| DeadlineWH | Deadline | 1.009075 | 41.12 |
| defense_news | Defense News | 1.28995 | 44.75 |
| democracynow | Democracy Now | 0.535568 | 30.99 |
| denverpost | Denver Post | 0.842916 | 49.23 |
| DeseretNews | Deseret News | 1.814912 | 44.62 |
| DNewsOpinion | Deseret News | 1.226862 | 44.62 |
| DrTurleyTalks | Turley Talks | 2.340149 | 22.26 |
| economics | Bloomberg Economics | 0.682349 | 47.56 |
| EconomistRadio | The Economist (Podcast) | 0.179752 | 44.09 |
| engadget | Engadget | 0.299701 | 45.06 |
| EpochTimes | Epoch Times | 1.477463 | 17.93 |
| FAIRMediaWatch | FAIR | -1.79508 | 35.38 |
| FDRLST | The Federalist | 1.479967 | 23.82 |
| financialbuzz | Financial Buzz | 0.678021 | 46.52 |
| FiveThirtyEight | FiveThirtyEight | -1.05336 | 43.61 |
| Forbes | Forbes | 0.55705 | 43.49 |
| ForeignPolicy | Foreign Policy | 0.164173 | 42.11 |
| FortuneMagazine | Fortune | 0.33246 | 45.1 |
| FoxNews | Fox News | 1.506728 | 33.24 |
| FreeBeacon | Washington Free Beacon | 1.283718 | 33.86 |
| freep | Detroit Free Press | 0.916478 | 49.26 |
| freespeechtv | Free Speech TV | -1.69231 | 23.35 |
| FT | Financial Times | 0.394507 | 45.04 |
| glennbeck | The Glenn Beck Program | 1.437909 | 13.45 |
| goodnewsnetwork | Good News Network | -1.18944 | 44.72 |
| guardian | The Guardian | 0.343094 | 44.56 |
| hartfordcourant | Hartford Courant | -0.42657 | 47.64 |
| HillReporter | Hill Reporter | 0.553383 | 37.48 |
| HoustonChron | Houston Chronicle | 0.80959 | 48.2 |
| HuffPost | HuffPost | 1.056025 | 41.84 |
| HuffPostCollege | HuffPost College | 0.359168 | 41.84 |
| HuffPostEdu | HuffPostEducation | -1.31522 | 41.84 |
| Independent | The Independent | -0.04464 | 41.96 |
| indystar | Indianapolis Star | 0.912859 | 48.32 |
| insideclimate | Inside Climate News | 0.425604 | 45.76 |
| inthesetimesmag | In These Times | -2.02446 | 34.39 |
| IQ2US | Intelligence Squared US | 1.130849 | 42.02 |
| jacobinmag | Jacobin | -2.42208 | 28.86 |
| Jezebel | Jezebel | -2.03129 | 27.32 |
| joerogan | The Joe Rogan Experience | 0.927301 | 38.32 |
| jonlovett | Lovett or Leave It | 0.412332 | 23.49 |
| journalsentinel | Milwaukee Journal Sentinel | 1.030057 | 48.07 |
| JudicialWatch | Judicial Watch | 1.59061 | 20.01 |
| kairyssdal | Make Me Smart | 1.147055 | 42.05 |
| KCStar | Kansas City Star | 0.700452 | 44.37 |
| laconiadailysun | Laconia Daily Sun | 1.600627 | 45.27 |
| latimes | Los Angeles Times | 0.786271 | 46.94 |
| LifeNews | Life News | 0.50599 | 21.67 |
| LifeZette | LifeZette | 1.622148 | 19.45 |
| MailOnline | Daily Mail | 1.196916 | 31.11 |
| Marketplace | Marketplace (Podcast) | 0.889297 | 44.91 |
| MarketWatch | Marketwatch | 1.288964 | 44.55 |
| marklevinshow | The Mark Levin Show | 2.031643 | 8.72 |
| martinepowers | Post Reports | -0.56663 | 44.53 |
| mashable | Mashable | 0.176562 | 46.46 |
| mediaite | MediaIte | 1.1007 | 39.96 |
| megynkelly | The Megyn Kelly Show | 1.298299 | 35.83 |
| MegynKellyShow | The Megyn Kelly Show | 1.491943 | 35.83 |
| mercnews | Mercury News | -0.09385 | 46.87 |
| michaeljknowles | The Michael Knowles Show | 1.763786 | 20.69 |
| mikiebarb | The Daily | 0.963674 | 44.46 |
| mollywood | Make Me Smart | 0.275176 | 42.05 |
| monthly | Washington Monthly | -1.36911 | 29.91 |
| MotherJones | Mother Jones | -2.43486 | 39.94 |
| myfairobserver | Fair Observer | 0.915647 | 35.11 |
| NatCounterPunch | Counterpunch | -1.63482 | 31.46 |
| NatEnquirer | National Enquirer | 0.55947 | 10.65 |
| NationalFile | National File | 2.030604 | 16.62 |
| NBCLA | NBC LA | 0.444003 | 46.47 |
| NBCNews | NBC News | -0.58378 | 46.81 |
| neutralnews | Neutral News | 1.265621 | 7.63 |
| NewAbnormalPod | The New Abnormal | 0.347996 | 22.18 |
| NewAmericanMag | The New American | 1.865105 | 16.3 |
| newrepublic | New Republic | 0.533944 | 34.37 |
| newsbusters | News Busters | 1.765539 | 28.93 |
| newsday | NewsDay | 0.542141 | 47.12 |
| Newser | Newser | 0.696895 | 44 |
| newsmax | NewsMax | 1.61212 | 26.68 |
| NewsNationNow | NewsNation Now | -0.52122 | 45.3 |
| newsone | NewsOne | -1.39126 | 35.77 |
| Newsweek | NewsWeek | 0.05397 | 39 |
| Newsy | Newsy | 0.708822 | 48.93 |
| NewYorker | The New Yorker | -0.78714 | 42.41 |
| njdotcom | NJ.com | 0.489625 | 46.92 |
| NOLAnews | NOLA.com | 0.381592 | 47.77 |
| novapbs | Nova PBS | 0.046341 | 48.16 |
| NPR | NPR | 1.08607 | 48.18 |
| npratc | Consider This (from NPR) | 0.046379 | 47.5 |
| NPRCodeSwitch | Code Switch | -0.69059 | 33.79 |
| nprfreshair | Fresh Air | -0.40905 | 46.09 |
| NPRNewsNow | NPR News Now | 1.08607 | 51.51 |
| nprpolitics | NPR Politics Podcast | 1.159208 | 43.19 |
| NRO | National Review | 1.530468 | 31.27 |
| NYDailyNews | New York Daily News | 0.375823 | 39.24 |
| NYMag | New York Magazine | 0.480357 | 42.26 |
| nypost | New York Post | 1.351933 | 35.28 |
| nytclimate | NYT Climate | -1.53751 | 46.35 |
| nytimes | The New York Times | -1.5741 | 46.35 |
| nytimesworld | NYT World | 0.563206 | 46.35 |
| nytopinion | New York Times Opinion | 0.458477 | 46.35 |
| OANN | OAN Network | 1.423893 | 23.06 |
| OccupyDemocrats | Occupy Democrats | -0.08171 | 22.57 |
| ocregister | Orange County Register | 1.262389 | 48 |
| onthemedia | On the Media | 0.778989 | 43.9 |
| Oregonian | The Oregonian | 0.704493 | 48.34 |
| orlandosentinel | Orlando Sentinel | 0.311647 | 47.98 |
| OWHnews | Omaha World-Herald | 0.886418 | 47.95 |
| ozy | Ozy | -1.17234 | 42.65 |
| patribotics | Patribotics | 1.12402 | 10.99 |
| PBS | PBS | -0.18421 | 49 |
| PBSDS | PBS | -0.44995 | 48.16 |
| PBSSoCal | PBS | -1.00592 | 48.16 |
| petersuderman | The Reason Roundtable | 1.072177 | 40.69 |
| PittsburghPG | Pittsburgh Post-Gazette | 0.801011 | 48.29 |
| PJMedia_com | PJ Media | 1.373369 | 18.74 |
| planetmoney | Planet Money | -1.21145 | 45.27 |
| PodSaveAmerica | Pod Save America | -2.2925 | 30.54 |
| politico | Politico | 1.226439 | 45.58 |
| politicususa | Politicus | -2.00371 | 31.97 |
| POPSUGAR | Popsugar | -1.26183 | 35.29 |
| PostStandard | Syracuse Post-Standard | 0.84296 | 47.33 |
| prageru | PragerU | 1.387027 | 22.47 |
| PreetBharara | Stay Tuned with Preet | 0.836057 | 45.05 |
| ProjectLincoln | The Lincoln Project | 0.496148 | 33.77 |
| propublica | ProPublica | -0.1553 | 47.97 |
| Quillette | Quillette | 0.249397 | 39.02 |
| qz | Quartz | -1.27277 | 44.41 |
| RadioTimes | Radio Times | -0.57404 | 39.73 |
| Rasmussen_Poll | Rasmussen Reports | 1.900267 | 41.5 |
| RawStory | Raw Story | 0.534789 | 33.1 |
| RealCandaceO | The Candace Owens Show | 1.404249 | 13.63 |
| RealClearNews | RealClear Politics | 1.20304 | 35.94 |
| realDailyWire | The Daily Wire | 1.862288 | 26.68 |
| reason | Reason | 1.160656 | 38.08 |
| RedState | RedState | 1.950823 | 21.11 |
| Reuters | Reuters | 0.329842 | 51.64 |
| reviewjournal | Las Vegas Review Journal | 1.186867 | 41.68 |
| RightWingWatch | Right Wing Watch | 1.168313 | 27.74 |
| rollcall | Roll Call | 1.228421 | 47.82 |
| Roughly | Rough Translation | -1.93051 | 42.45 |
| RT_com | Russia Today | 1.220437 | 30.42 |
| RubinReport | The Rubin Report | 1.414917 | 22.37 |
| Salon | Salon | 0.685338 | 36.54 |
| SCMPNews | South China Morning Post | 0.649584 | 41.87 |
| SCrowder | Louder with Crowder | 1.7128 | 7.81 |
| seattlepi | Seattle PI | 0.78793 | 43.69 |
| SecondNexus | Second Nexus | -1.75661 | 24.19 |
| sfchronicle | San Francisco Chronicle | -0.06142 | 46.17 |
| sfexaminer | SF Examiner | -1.33672 | 44.13 |
| SFGate | SF Gate | 0.84829 | 46.42 |
| sfindependent | Independent Journal | -0.37331 | 42.03 |
| shadowproofcom | Shadowproof | -2.04707 | 37.25 |
| Slate | Slate | 0.063597 | 35.39 |
| SlateGabfest | Political Gabfest | 1.06057 | 43.45 |
| sltrib | Salt Lake Tribune | 1.182547 | 47.03 |
| snopes | Snopes | 0.23481 | 46.93 |
| Sojourners | Sojourners | 0.389041 | 38.07 |
| SputnikInt | Sputnik International News | 0.027663 | 36.71 |
| starsandstripes | Stars and Stripes | 0.638487 | 50.22 |
| StartHereABC | Start Here | 1.002761 | 47.72 |
| StarTribune | Star Tribune-Minneapolis | 0.676742 | 47.01 |
| SunSentinel | Sun Sentinel | 1.066508 | 46.32 |
| Suntimes | Chicago Sun-Times | 0.779888 | 46.88 |
| SykesCharlie | The Bulwark Podcast | 1.281244 | 36.46 |
| SYSKPodcast | Stuff You Should Know | -0.89381 | 41.6 |
| TB_Times | Tampa Bay Times | 0.98586 | 46.51 |
| teamtrace | The Trace | 0.285624 | 45.91 |
| TechCrunch | TechCrunch | 0.880202 | 46.2 |
| TeenVogue | Teen Vogue | -1.11886 | 40 |
| Tennessean | Tennessean | 1.118627 | 48.66 |
| TheAdvocateMag | Advocate | -1.6401 | 37.02 |
| theamgreatness | American Greatness | 1.940906 | 19.38 |
| TheAspenTimes | Aspen Times | 0.165323 | 46.31 |
| TheAtlantic | The Atlantic | 0.1664 | 40.3 |
| theblaze | The Blaze | 1.564098 | 31.07 |
| thedailybeast | The Daily Beast | 0.717455 | 36.62 |
| TheDailyShow | The Daily Show | 0.564617 | 30.6 |
| thedispatch | The Dispatch | 2.099772 | 42.74 |
| TheEconomist | The Economist | 0.179752 | 43.67 |
| TheFiscalTimes | Fiscal Times | 1.184618 | 44.25 |
| TheGrayzoneNews | The Grayzone News | -0.5509 | 29.12 |
| theGrio | TheGrio | -1.63579 | 38.42 |
| thehill | The Hill | 1.268027 | 45.7 |
| theinquisitr | Inquisitr | 1.392829 | 33.52 |
| theintercept | The Intercept | -0.7333 | 41.33 |
| TheLastRefuge2 | The Last Refuge | 1.572432 | 17.49 |
| thenation | The Nation | -0.28512 | 35.03 |
| theprogressive | The Progressive | 0.579812 | 34.62 |
| TheRightScoop | The Right Scoop | 2.245264 | 20.23 |
| TheRoot | The Root | 0.11318 | 29.67 |
| theskimm | The Skimm | 0.362405 | 42.22 |
| TheWeek | The Week | 0.855985 | 36.76 |
| thinkprogress | ThinkProgress | -1.36242 | 34.31 |
| ThisAmerLife | This American Life | -1.05143 | 43.05 |
| TIME | Time Magazine | 0.203706 | 43.36 |
| TMZ | TMZ | 0.158379 | 39.61 |
| townhallcom | Townhall | 1.762433 | 26.57 |
| TPM | Talking Points Memo | 0.35744 | 42.5 |
| trish_regan | Trish Intel | 1.332012 | 14.14 |
| truthout | Truthout | -1.05841 | 26.97 |
| TucsonStar | Arizona Daily Star | 1.143182 | 45.81 |
| TwitchyTeam | Twitchy | 1.907385 | 16.47 |
| UpFirst | Up First | -1.51354 | 48.4 |
| UPI | UPI | 0.665729 | 48.74 |
| Upworthy | Upworthy | -0.84939 | 39.85 |
| USATODAY | USA Today | 0.443197 | 46.41 |
| usnews | US News and World Report | 1.205705 | 45.58 |
| VanityFair | Vanity Fair | 0.04879 | 35.74 |
| Variety | Variety | 1.084381 | 40.97 |
| VICENews | VICE News | -0.95415 | 39.59 |
| VOANews | Voice of America | 0.442889 | 47.92 |
| voxdotcom | Vox | -0.08375 | 42.08 |
| washingtonpost | Washington Post | 0.721329 | 44.22 |
| WashTimes | Washington Times | 1.566724 | 26.85 |
| weatherchannel | The Weather Channel | 0.664555 | 50.82 |
| WestJournalism | Western Journal | 1.657436 | 23.8 |
| WhatsNewsWSJ | What's News | 1.1857 | 48.75 |
| Wonkette | Wonkette | -1.52707 | 18.23 |
| worldnetdaily | WND | 1.945055 | 18.47 |
| WSJ | Wall Street Journal | 1.370485 | 47.03 |
| WSJPodcasts | The Journal | 1.370485 | 51.18 |
| wvgazettemail | Charleston Gazette-Mail | 0.470223 | 45.74 |
| zerohedge | ZeroHedge | 1.15548 | 27.64 |
| wvgazettemail | Charleston Gazette-Mail | 0.470223 | 45.74 |
| zerohedge | ZeroHedge | 1.15548 | 27.64 |
Appendix 2
Schools included in sample: American University, Arizona State University, Arkansas State University, Auburn University, Brigham Young University, Citrus College, El Camino Community College, Harvard University, New York University, Pierce College, Princeton University, Seattle University, the Ohio State University, UC Berkeley, UC Merced, UC Riverside, UC Santa Barbara, UCLA, the University of Arizona, the University of Southern California, UT Austin, Washington State University, and Yale University.