
A Demographic Portrait of University of California Muslim Students
As the population of young Muslim Americans increases, U.S. educational institutions need to be prepared to address the needs of this racially-heterogeneous community. This infographic begins to describe the demographic characteristics of the Muslim students at the University of California. Findings are based on a representative sample of over 54,000 undergraduate students, including over 1,000 Muslim students, who responded to the 2016 University of California Undergraduate Experience Survey (UCUES). Results suggest UC Muslim students are a diverse group of students that exhibit different demographic and student characteristics. For example, though Muslims are religious minorities on UC campuses, they are a racially heterogeneous group with majority immigrant backgrounds. Most Muslim students are women, enroll in STEM, and come from middle class backgrounds. Muslim students are represented among international students, first generation college students, transfer students, and students who participate in student organizations. In fact, Muslim students are more active than most groups and tend to be politically more liberal compared to their religious and nonreligious peers.
Muslim Students Are Religious Minorities on Campus
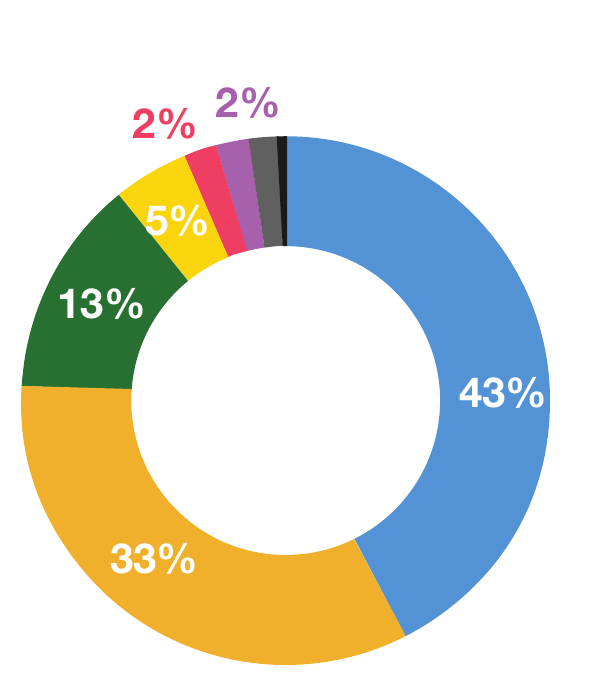
Muslim students are only about 2% of the University of California student population. The majority are nonreligious students at 43% and Christian at 33%. The source does not identify the remaining chart categories.
Majority of Muslim Students Are Women
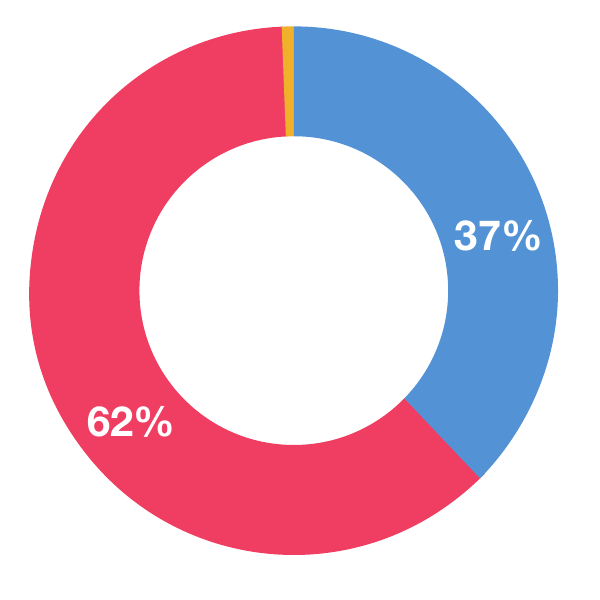
Within the Muslim community, the majority identify as women at 62%. The source does not identify the 37% slice or the smallest slice, and it prints no value for the smallest slice.
Muslim Students Are Racially Diverse
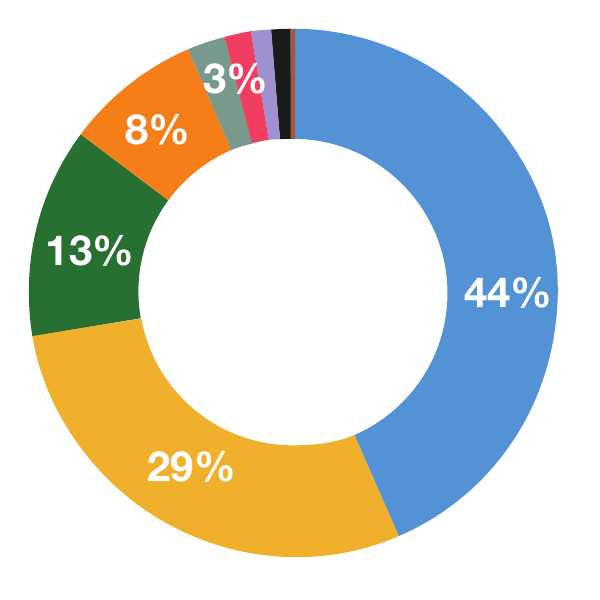
Muslim students are a racially heterogeneous group. They include students who identify as Middle Eastern or North African, designated White, at 44%; South Asian at 29%; Southeast Asian at 13%; and African, Black, or Caribbean at 8%. The source shows a 3% slice and smaller slices without identifying their categories.
A Majority of Muslim Students Come from Immigrant Backgrounds
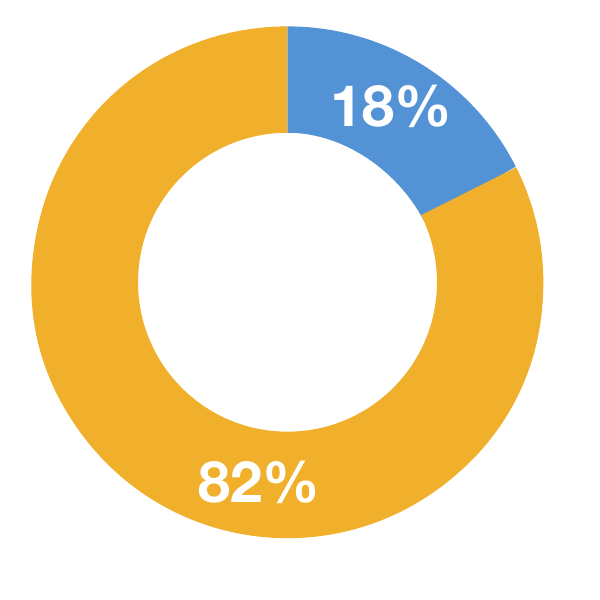
Eighty-two percent of Muslim students come from first- and second-generation immigrant backgrounds, compared with 52% of all other UC students.
About Half of Muslim International Students Identify as Middle Eastern North African
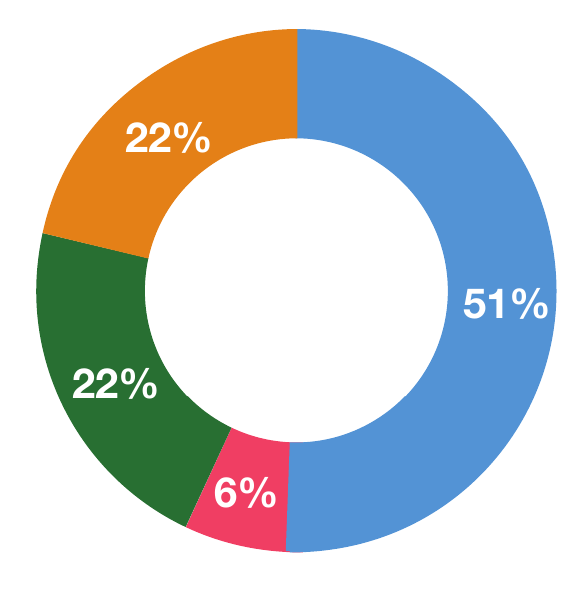
About 8% of Muslim UC students are international students. Within that group, 51% identify as Middle Eastern or North African, 22% as South Asian, 22% as Southeast Asian, and 6% as Black or African. The percentages total 101% because of source rounding.
Muslim Students Have Different Social Class Backgrounds
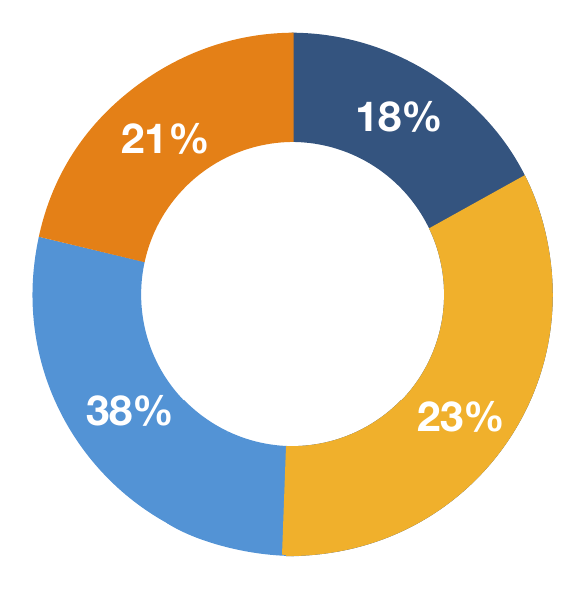
Muslim students describe their social class as middle class at 38%, working class at 23%, upper class or wealthy at 21%, and low-income at 18%.
Most Muslim Students Have Parents with College Degrees
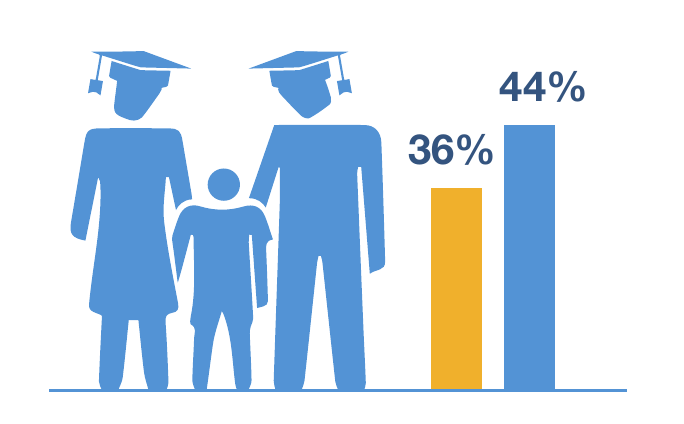
Among UC students, about 44% are the first generation in their families to obtain a college degree, compared with 36% of Muslim students.
A Higher Percentage of Muslims Are in STEM
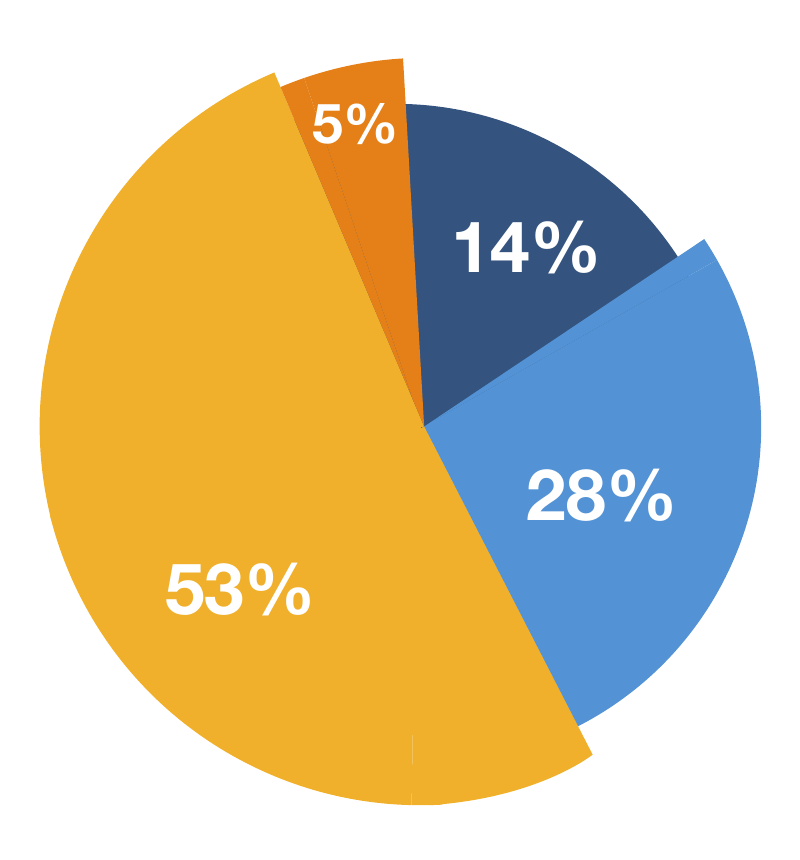
Fifty-three percent of Muslim students enroll in STEM, compared with 43% of other religious students and 48% of nonreligious students. Social sciences account for 28%, arts and humanities 14%, and undeclared students 5%.
Muslim Students Are More Likely to Work During College
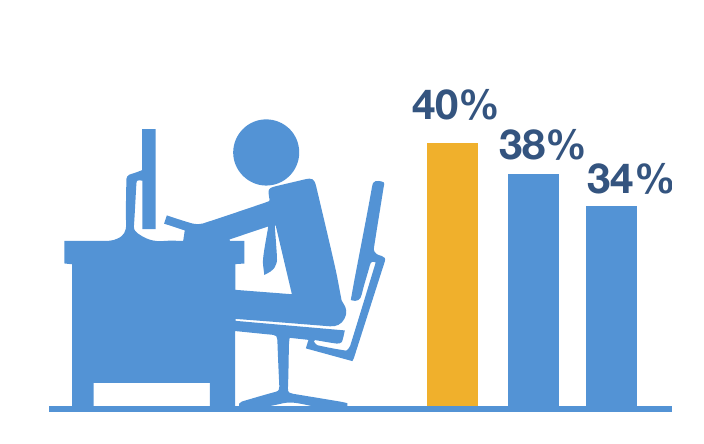
Forty percent of Muslim students took a job for the first time in college to meet expenses, compared with 36% of UC students overall, 38% of religious students, and 34% of nonreligious students.
Most Muslim Students Are Not Transfer Students
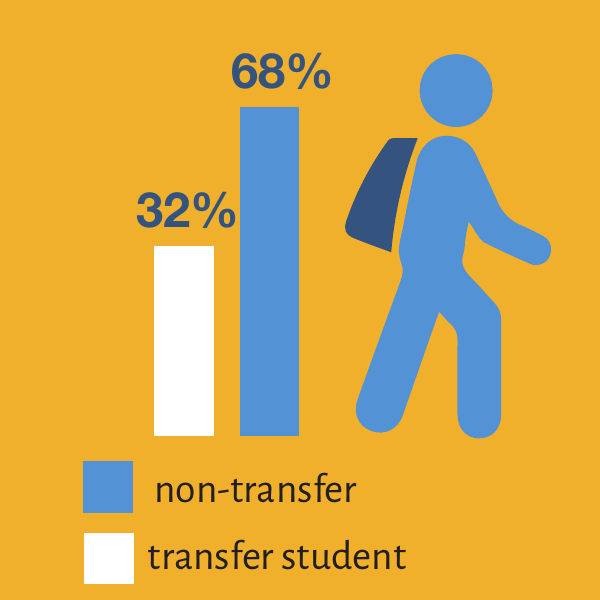
Thirty-two percent of Muslim students are transfer students and 68% are not. About 20% of UC students overall were transfer students in 2016.
Most Muslim Students Live Off Campus
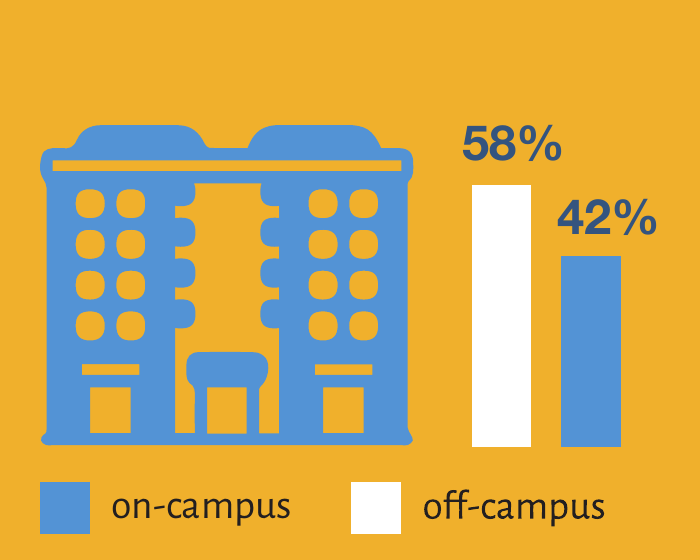
The source prose says 58% of Muslim students live off campus, compared with 56% of UC students. The source legend reverses the on-campus and off-campus labels, so this finding still requires editorial review.
More Muslim Students Participate in Student Organizations
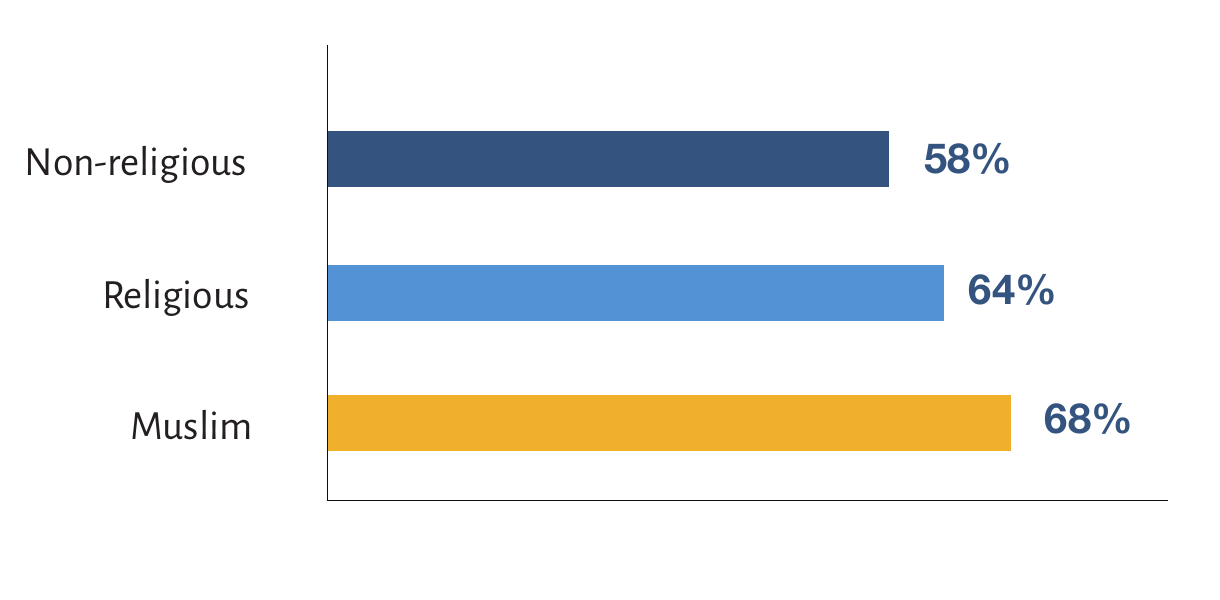
Participation is 68% among Muslim students, 64% among religious students, and 58% among nonreligious students. The source reports 61% for UC students overall.
Majority of Muslim Students Are Liberal or Moderate
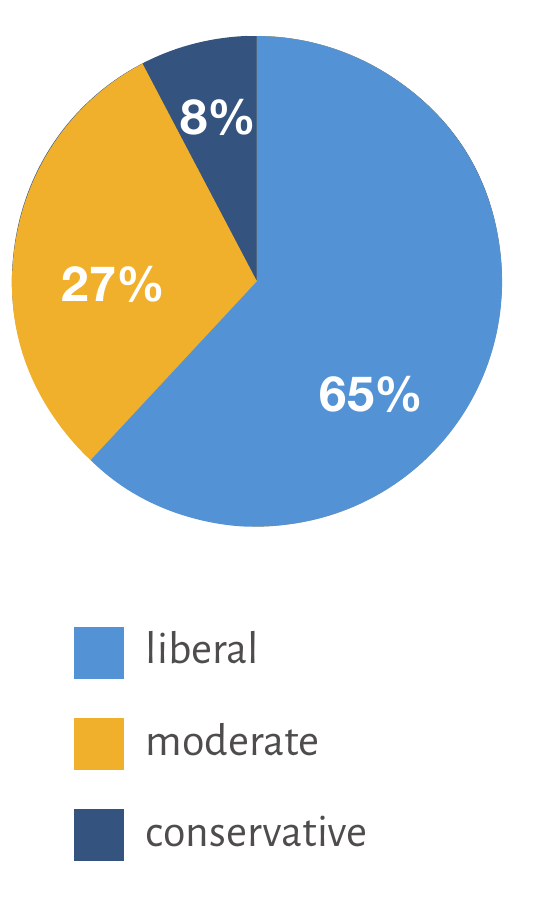
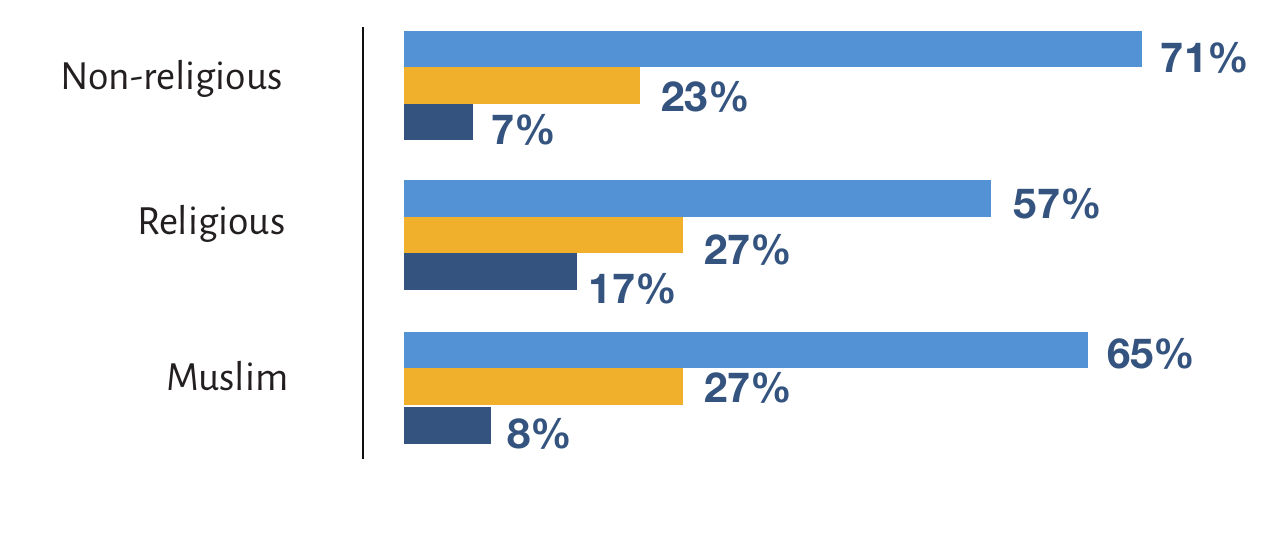
Muslim students identify as liberal or very liberal at 65%, moderate at 27%, and conservative at 8%. Other religious students report 57%, 27%, and 17%. Nonreligious students report 71%, 23%, and 7%. The religious and nonreligious totals are 101% because of source rounding.
| Group | Liberal or very liberal | Moderate | Conservative |
|---|---|---|---|
| Nonreligious | 71% | 23% | 7% |
| Religious | 57% | 27% | 17% |
| Muslim | 65% | 27% | 8% |
Funding for this study was provided by the University of California National Center for Free Speech and Civic Engagement. Data for this report was provided by Institutional Research, Assessment, and Policy Studies (IRAPS) at UC Santa Cruz (UCSC).
The author is a Ph.D. Candidate at the University of California, Santa Cruz. Contact: snojan@ucsc.edu.
Suggested citation: Nojan, Saugher. 2020. “Examining Civic Engagement and Campus Climates among University of California Muslim Students.” University of California, National Center for Free Speech and Civic Engagement. Accessed: freespeechcenter.universityofcalifornia.edu/fellows-19-20/nojan-research.